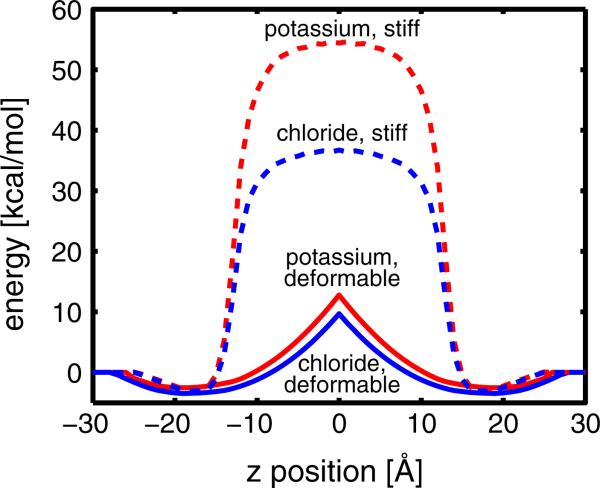
Fig. 3.
Free energy profiles along the transmembrane coordinate for a cation and an anion. We translated K+ (red curves) or Cl– (blue curves) across the membrane in 1 Å steps with the ion initially positioned in bulk solvent approximately 6 Å from the membrane–water interface (z = –30 Å). Dashed lines correspond to calculations carried out on a stiff, unbending bilayer, while solid lines correspond to calculations carried out using the membrane bending model and minimizing the total energy in Eq. 1. Bending dramatically reduces the energy required to move ions into the center of the membrane by 12–30 kcal/mol. The membrane dipole reduces Cl– penetration by ~20 kcal/mol over K+ in the non-deformable model (difference between dashed curves), but only by 2–3 kcal/mol in the membrane bending model (difference between solid curves) because ions never experience the full dipole potential in the later case (Color figure online)

