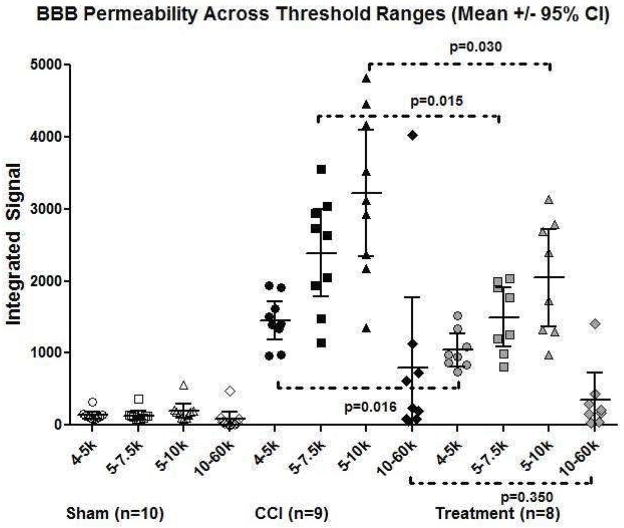
Figure 5.
A scatter plot representation of Figure 4 demonstrates integrated signal across each threshold intensity range for the three experimental groups. Despite the wide spread within each treatment group suggesting heterogeneity of injury, there is a consistent trend within each treatment group from the three low + narrow threshold ranges to the one high + wide threshold range. A significant therapeutic effect is seen between treated versus CCI rats in the low + narrow threshold ranges, which correspond to the red rims identified in Figure 4 (likely at-risk penumbral regions of BBB permeability).

