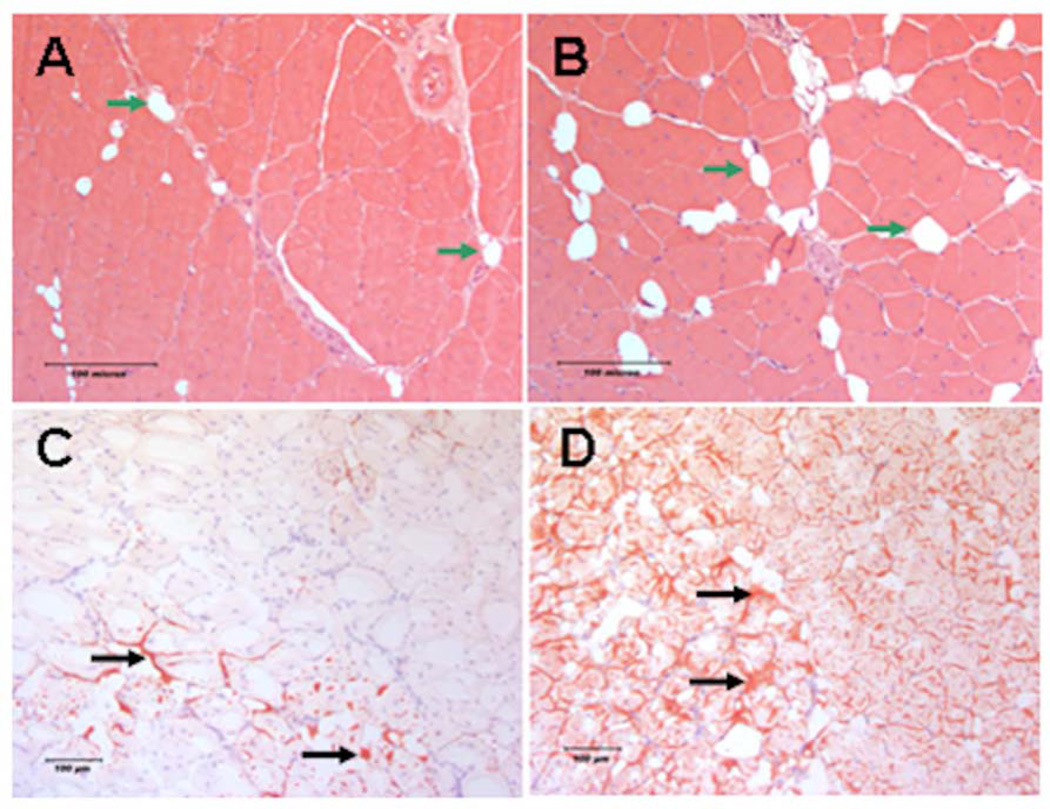
Figure 6. Histologic evaluation of skeletal muscle regeneration following IR.
Representative images of regenerating TA muscle cross section obtained 28 days after IR. Images A and B are 200× H & E stained muscle from ND and DIO respectively. Regenerating myofibers present centrally localized nuclei. Green arrows indicate intramuscular adipocytes. There was significantly less centrally nucleated fibers and higher fat area measured in the DIO group compared to ND. Images C and D are 100× Oil Red O stained frozen TA muscle cross sections from ND and DIO mice respectively. Black arrows indicate fat accumulated between the myofibers. There is more extensive Oil Red O staining observed in the DIO muscle cross sections compared to ND indicating more fat accumulation in the tissue 28 days after IR.

