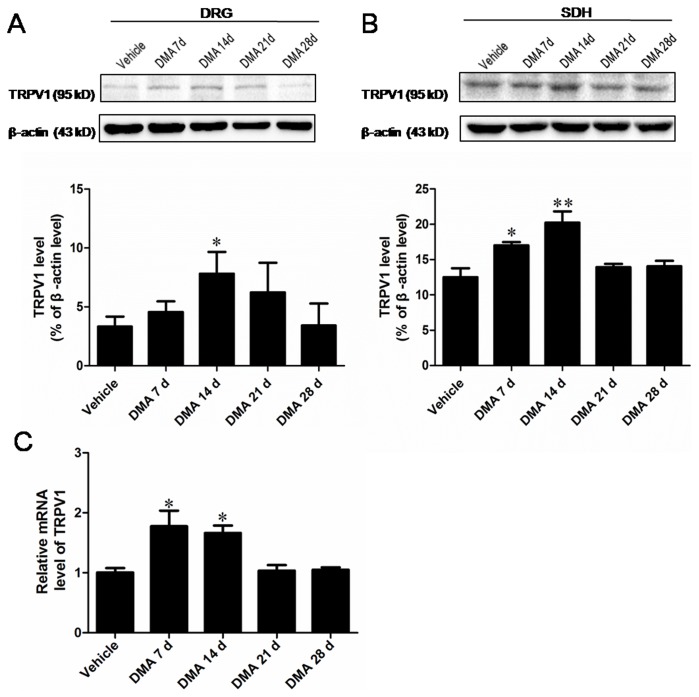
Figure 2. Expression tendency of TRPV1 in DRG and SDH with the progression of DMA.
A and B, Western blot assay of TRPV1 in extracts of DRG (A) and SDH (B). Upper lane, typical blotting band. Lower lane, the densitometric analysis reveals the significant increase of TRPV1 protein in DRG on DMA 14 d and increase of TRPV1 in SDH on DMA 7 d and 14 d. C, Quantitative RT-PCR assay of TRPV1 expression at mRNA level revealing the marked increase of TRPV1 transcripts in DRG on DMA 7 d and 14 d. Data are represented as the mean S.E.M (n = 6).*P<0.05, **P<0.01 vs. vehicle control.

