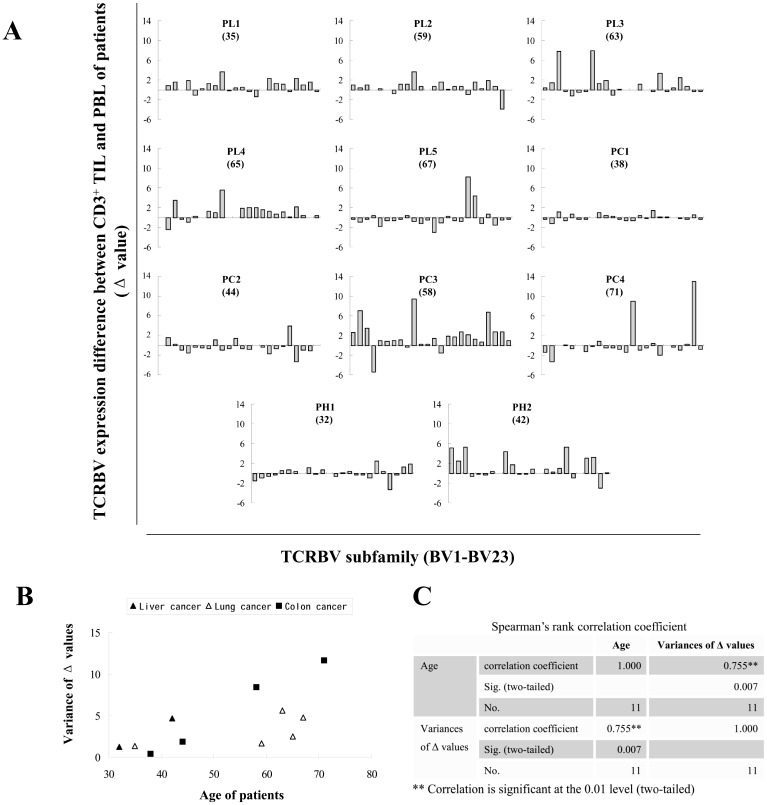
Figure 2. Analysis of expression difference of TCR-Vβ repertoire between TIL and PBL of cancer patients.
(A) Expression difference of TCR-Vβ subfamily between TIL and PBL (Δ value) is calculated as the percentage of each TCR-Vβ subfamily in CD3+ TIL minus the counterpart in CD3+ PBL. All 24 Δ values (for 24 TCR-Vβ subfamilies) were used to generate a histogram for each patient. The numbers in brackets are the ages of patients. (B) The dispersion degree of Δ values is expressed as variance. The variances were subsequently matched with the age of the patient to generate a scatter plot. (C) The linear correlation coefficient between variance and age was subsequently computed by SPSS software with Spearman's rank-order correlation model.

