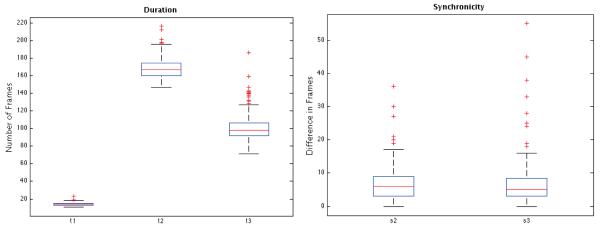
Figure 11.

Box plots of measurements described in Table 1, obtained from a subset of 92 embryos in the cell tracking database (those embryos for which pronuclear envelope breakdown was clearly visible). To convert the vertical axis in clock time, recall that consecutive frames are 7 minutes apart.
