Figure 1.
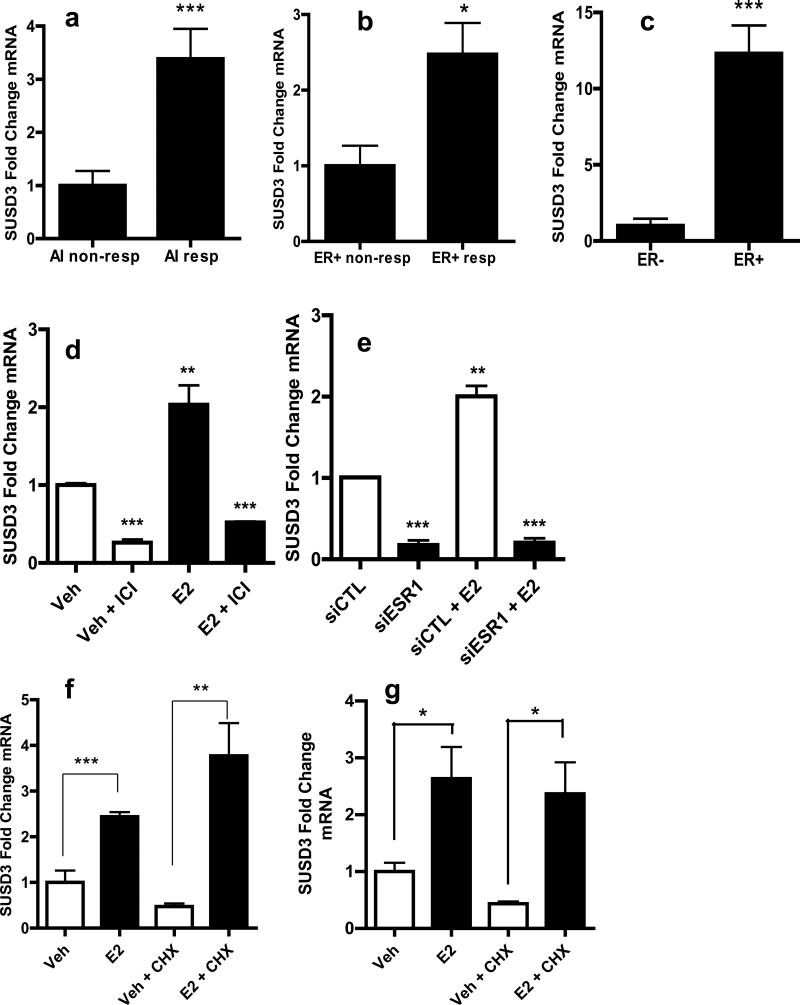
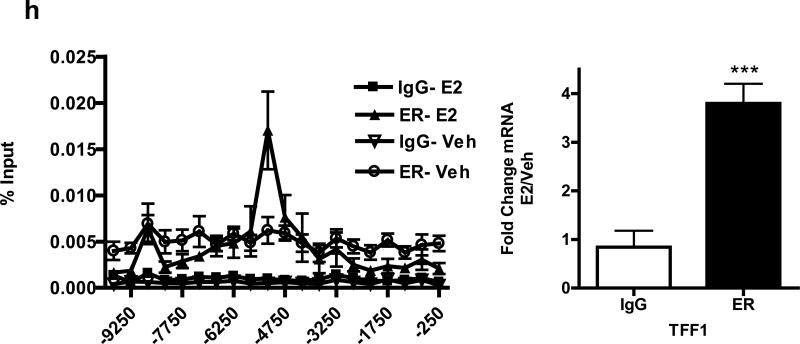
SUSD3 expression is up-regulated in AI non-responders and regulated by ERα. (a) Real-time PCR was performed on a total of 49 patient tumor samples. SUSD3 mRNA expression in AI responders (n=27) vs. non-responders (n=22). (b) SUSD3 mRNA expression in ERα positive/AI responders (n=27) vs. ERα positive/AI non-responders (n=15). (c) SUSD3 mRNA expression in ERα positive (n=42) vs. ERα negative tumors (n=7). Results are expressed as the means ± SD from triplicate experiments. (d) MCF7 cells were treated with vehicle control (EtOH), 100-nM E2, 10-μM ICI 182780, or both. SUSD mRNA was quantified by RT-PCR. Cells were pretreated with ICI 182780 1h prior to the addition of E2. (e) siRNA-mediated knockdown of ERα followed by treatment with vehicle control or 100-nM E2. *, p< 0.05; **, p< 0.01; ***, p< 0.001. (f) SUSD3 mRNA expression in MCF7 cells and (g) T47D cells after treatment with vehicle control, 100-nM E2, 5-μM cycloheximide (CHX), or both. (h) ChIP assay performed with ERα antibody in MCF7 cells treated with vehicle (EtOH) or 100-nM E2 for 30min. Amplicons 10 kb upstream of SUSD3 exon 1 are shown. Mock ChIP was performed with IgG as a control. Error bars represent mean ± SD. TFF1 was used as a positive control and its mRNA expression after E2 treatment was compared to control. ***, p< 0.001. All experiments were performed in triplicate.


