
Figure 2.
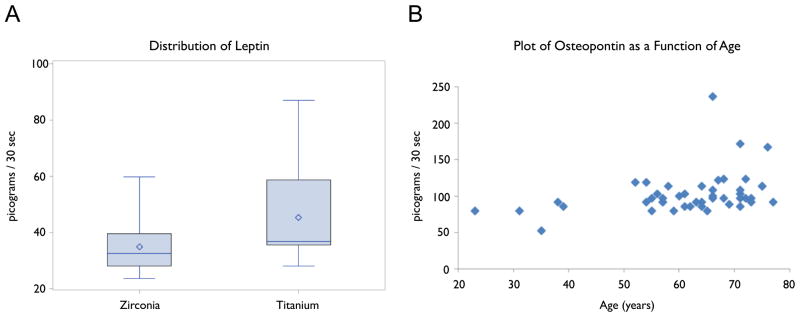
Figure 2A: Box plot depiction of leptin distribution between zirconia and titanium abutment groups sampled in picograms/30 seconds.
Figure 2B: Scatter plot of osteopontin (OPN) as a function of age. OPN was significantly correlated with age after adjustment for multiple comparisons.