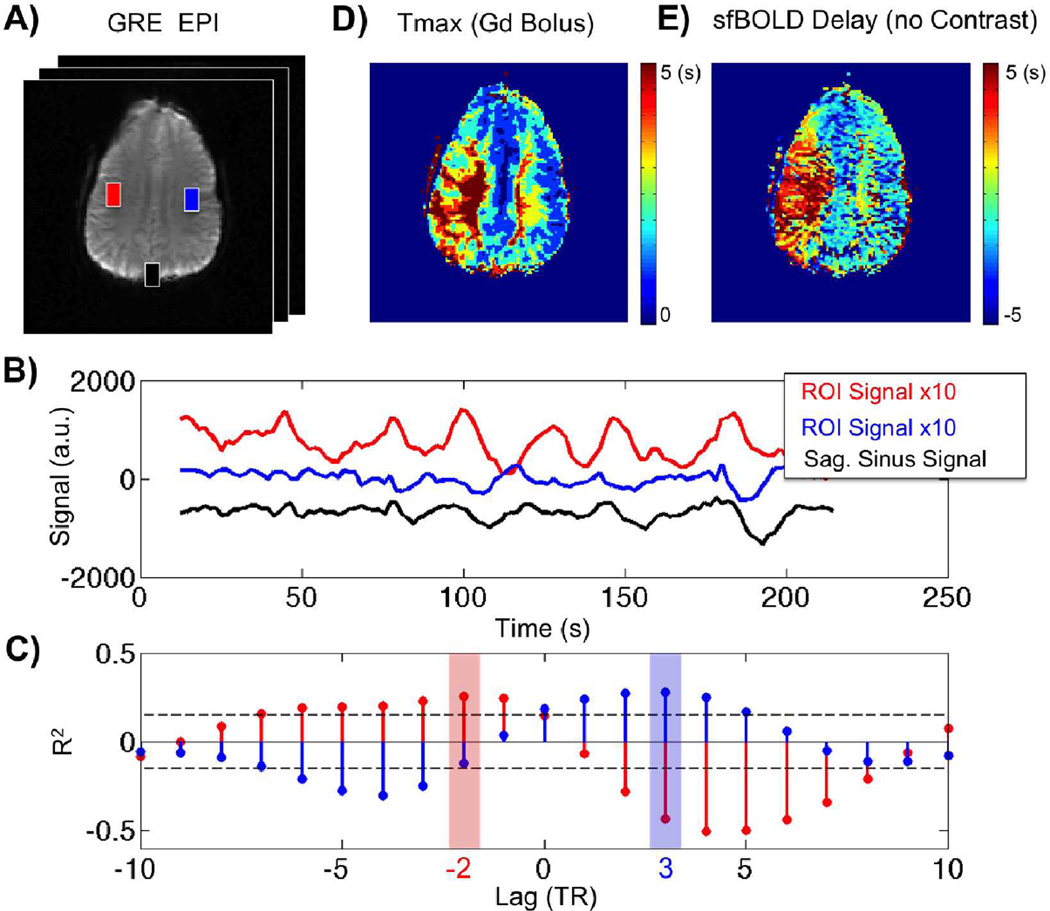
Figure 1.
Temporal correlation of resting-state BOLD spontaneous fluctuations in one patient with Moyamoya disease. a) Gradient-echo echo-planar image (EPI) image at a single time point, Tmax map obtained with gadolinium-based dynamic susceptibility contrast, and corresponding sfBOLD delay map obtained without contrast agent injection. b) sfBOLD signal time courses corresponding to the ROIs defined in (a): red: affected hemisphere, blue: unaffected hemisphere, black: SSS seed region. Note that different scales are used for easier visualization. c) Cross correlation analysis between ROI signal in tissue ROI’s (red and blue) with the SSS seed region (black). Maximum correlation is found at −2TR for the affected tissue (red) while +3TR is found for healthy tissue (blue). Dashed lines denote the confidence interval. Both maxima have a correlation coefficient (R2=0.25, R2=0.30 for blue and red ROI respectively) higher than the 95% confidence bound (R2=0.18). The (d) Tmax map (obtained with DSC) and (e) sfBOLD delay maps (obtained with the SSS as the seed region) from the same patient display similar characteristics, with delays present in the left hemisphere.

