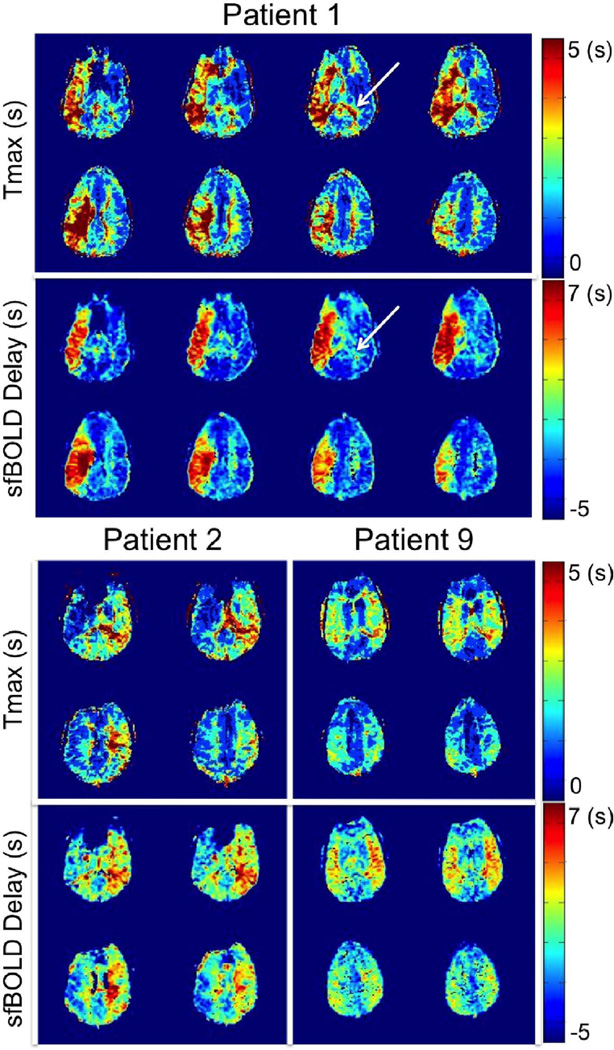
Figure 2.
Multislice comparison between Tmax maps and resting-state sfBOLD delay maps in 3 Moyamoya patients with unilateral (patient 1 and patient 2) or mild bilateral (patient 9) delays. While good agreement was found between both approaches, white arrows indicate regions showing high Tmax values but normal sfBOLD delays.

