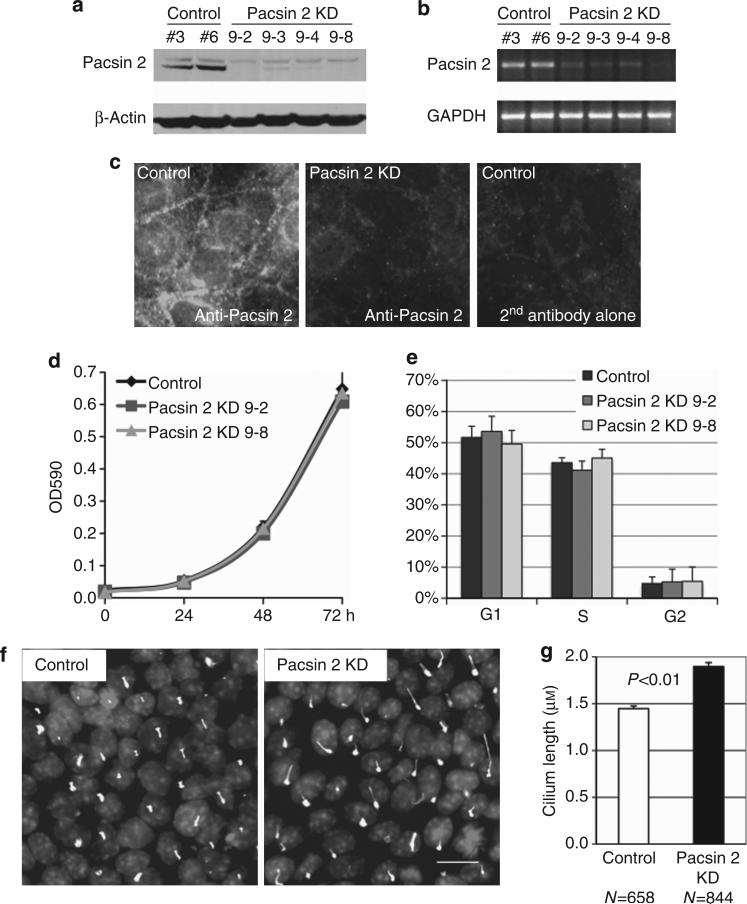
Figure 4. Establishment of stable lines of Pacsin 2 knockdown murine inner medullary collecting duct 3 (mIMCD3) cells by small hairpin RNA (shRNA).
(a) Western blot and (b) semiquantitative PCR demonstrate a significant reduction in the Pacsin 2 expression levels in four stable Pacsin 2 knockdown mIMCD3 clones, compared with the pSilencer control clones. GAPDH, glyceraldehyde-3-phosphate dehydrogenase. (c) Immunofluorescent images show that the apical localization of Pacsin 2 is significantly reduced in Pacsin 2 knockdown mIMCD3 cells. Secondary antibodies alone were used as a control for the specificity of the Pacsin 2 antibody. (d) MTT (3-[4,5-dimethylthiazol-2-yl]-2,5-diphenyl-tetrazolium bromide) assay and (e) fluorescence-activated cell sorting (FACS) analyses show that the cell proliferation rate and the cell cycle profile are similar between stable Pacsin 2 knockdown and control mIMCD3 cell lines. (f) Pacsin 2 knockdown mIMCD3 cells process longer primary cilia as compared with control cells. The primary cilia axoneme was stained by acetylated α-tubulin. Bar = 10 μm. (g) Graph demonstrating the length of the primary cilium. Control cells had an average cilium length of 1.45 μm (n = 658) as compared with 1.90 μm (n = 844) in knockdown cells. Error bars represent ± s.d. (n = 3). The significance was calculated by Student's t-test.

