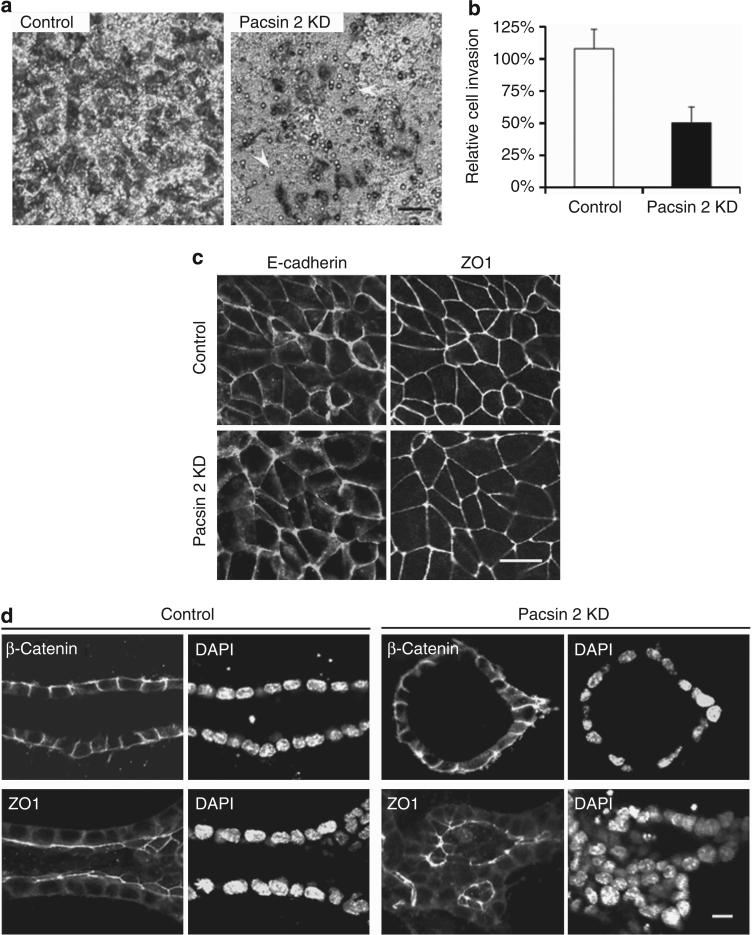
Figure 6. Pacsin 2 knockdown causes defects in cell invasion but not apical–basal polarity.
(a) Equal number of Pacsin 2 knockdown cells and control murine inner medullary collecting duct 3 (mIMCD3) cells were seeded into the apical chamber of collagen I–coated transwell filters (8 μm) and allowed to travel to the underside of the filters for 16 h. Hepatic growth factor (HGF; 20 ng/ml) was added to the lower chamber. Migrated cells were stained by Giemsa and photographed with an inverted phase-contrast microscope. Arrows mark pores within the surface of the filter. Bar = 50 μm. (b) Quantification of cell invasion. The number of cells traveled to the basal surface in 12 separated fields were counted and divided by the starting number of cells. The control mIMCD3 cells were used for reference and set at 100%. Depleting Pacsin 2 impaired mIMCD3 cell travel through a permeable membrane. Error bars represent±s.d. (n = 3). The significance was calculated by Student's t-test. P<0.01. (c) Pacsin 2 knockdown and control mIMCD3 cells exhibit normal tight junctions and cell–cell adhesions as analyzed by confocal microscopy. Tight junctions are labeled with ZO1, whereas cell–cell adhesions are stained with E-cadherin. Bar = 10 μm. (d) In 3D collagen gels, both ZO1 and β-catenin preserved a normal localization in structures formed by Pacsin 2 knockdown mIMCD3 cells as compared with tubules formed by control mIMCD3 cells in a tubulogenesis assay. DAPI, 4’,6-diamidino-2-phenylindole. Bar 10 = μm. A color version of c, d with Z-stack images for c is shown in Supplementary Figure S4 online.

