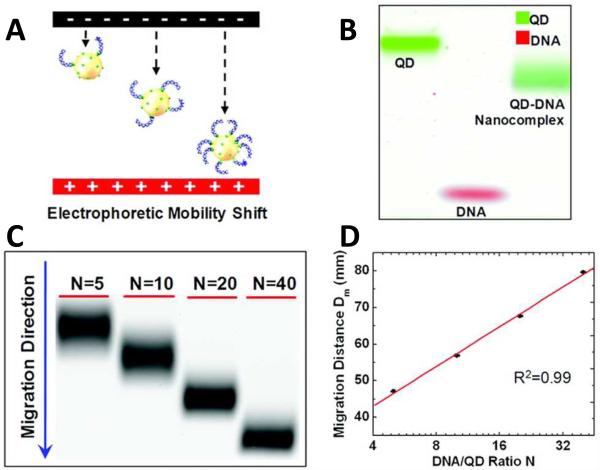
Figure 15.
Quantum Dot Electrophoretic Mobility Shift Assay (QEMSA). (A) Schematic diagram of electrophoretic mobility of streptavidin-coated QD conjugated with biotin-labeled DNA fragments. Their mobility increases with the number of DNA molecules assembled onto the QD surface. (B) Pseudocolor gel image shows that QD DNA nanocomplexes migrate faster than naked QD (green) while slower than DNA (red). (C) Gel image of QD-DNA nanocomplexes with different DNA: QD ratios, N, in agarose gel. (D) Migration curve of migration distance of each gel band versus ratio N in (C). Reprinted with permission from [102]. ©2012 American Chemical Society.

