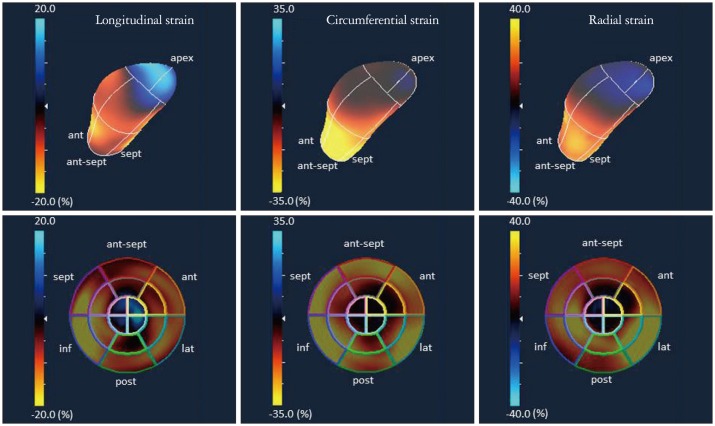
Fig. 10.
Regional wall motion abnormalities with 3-dimensional speckle tracking echocardiography. These images were obtained at experimental studies. Upper panels show plastic bag images and lower ones show polar map images at end-systole showing longitudinal strain (left panel), circumferential strain (central panel), and radial strain (right panel) during a coronary artery occlusion study. The blue area in the apex in each panel corresponds to dyskinetic motion induced by coronary artery occlusion.

