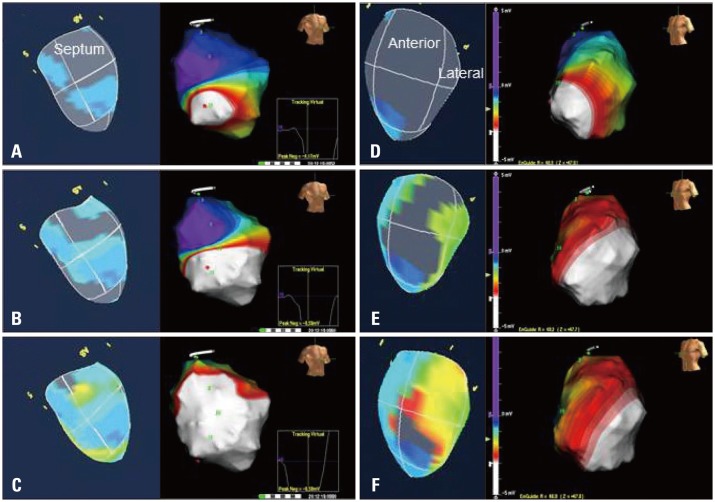
Fig. 11.
Comparisons of activation propagation in left bundle branch block. Left figures show activation images by 3-dimensional speckle tracking echocardiography (3D-STE) and right ones show propagation images by Ensite voltage mapping system in each panel from A to F. Panels A to C show the images from septum, and blue areas in the 3D-STE are the earliest contraction sites. White areas in the Ensite images are the electrical activation area. Panels D to F show the images from free wall, and yellow or orange areas are the latest contraction sites. Note the U shape propagation with functional block area in anterior wall.

