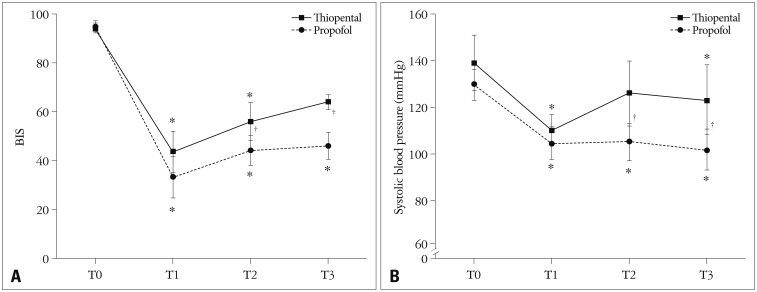
Fig. 1.
Comparison of serial hemodynamic changes between Thiopental and Propofol group. Serial bispectral index (BIS) (A), and systolic blood pressure (B) in the thiopental and propofol group, before and 1, 3, and 5 minutes after injection of anesthesia (T0, T1, T2, and T3, respectively). Thiopental: patients administered bolus thiopental 5.0 mg/kg, Propofol: patients administered bolus propofol 2.0 mg/kg. Values were median (interquartile). *p < 0.05 vs. T0 within the group by Friedman's test with multiple comparisons, †p < 0.05, between the group by the Wilcoxon-Mann-Whitney test. A significant group difference is noted 3 to 5 minutes after anesthesia injection.

