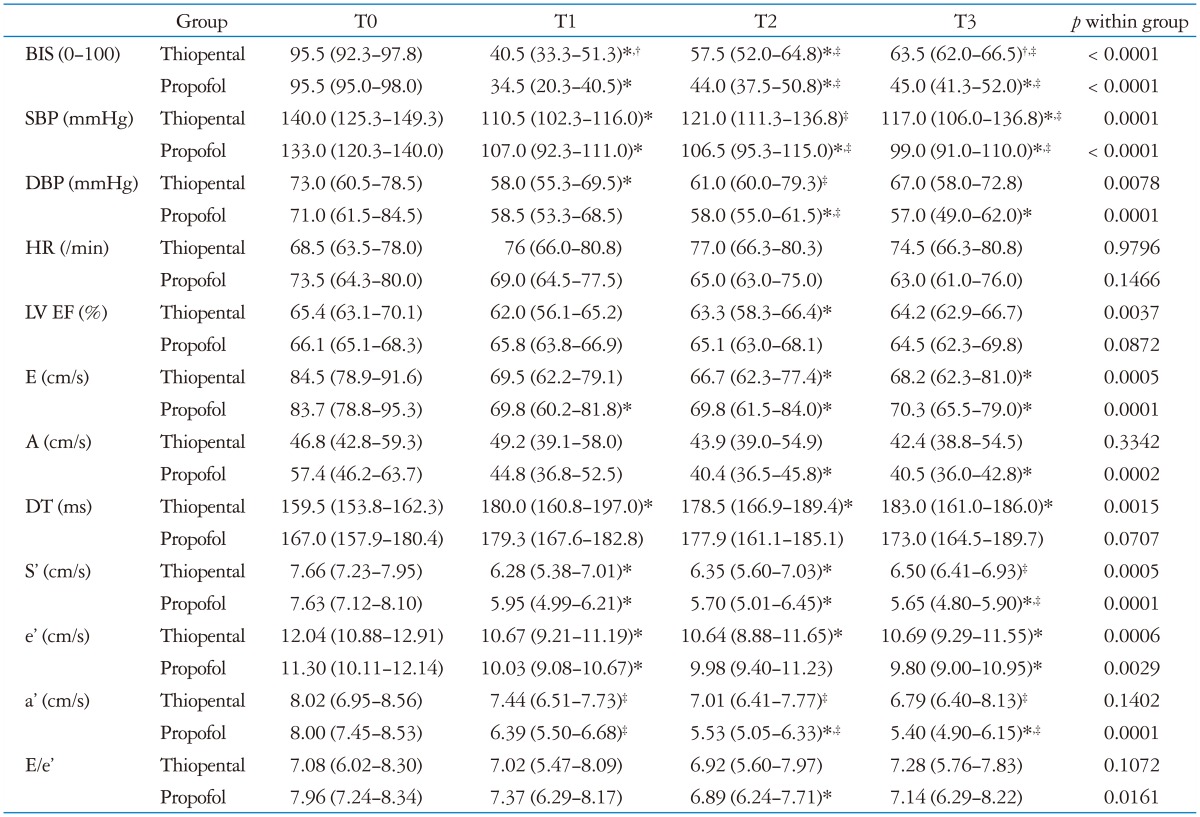
Table 2.
Cardiovascular data in Thiopental and Propofol groups

Baseline and follow-up data are expressed as median (interquartile range). Serial parameters before and 1, 3, and 5 minutes after intravenous bolus thiopental or propofol (T0, T1, T2, and T3, respectively). Thiopental: patients administered bolus thiopental 5.0 mg/kg, Propofol: patients administered bolus propofol 2.0 mg/kg. *p < 0.05: vs. T0 within the group, †p < 0.05: T1 vs. T3 within the group by Friedman's test with multiple comparisons, ‡p < 0.05: compared with same-time value in the other group by the Wilcoxon-Mann-Whitney test. BIS: bispectral index, SBP: systolic blood pressure, DBP: diastolic blood pressure, HR: heart rate, LV: left ventricular, EF: ejection fraction, E: mitral inflow peak early filling velocity, A: mitral inflow peak late filling velocity, DT: deceleration time of E velocity, S': mitral septal annular systolic myocardial velocity, e': mitral septal annular early diastolic myocardial relaxation velocity, a': mitral septal annular velocity associated with atrial contraction
