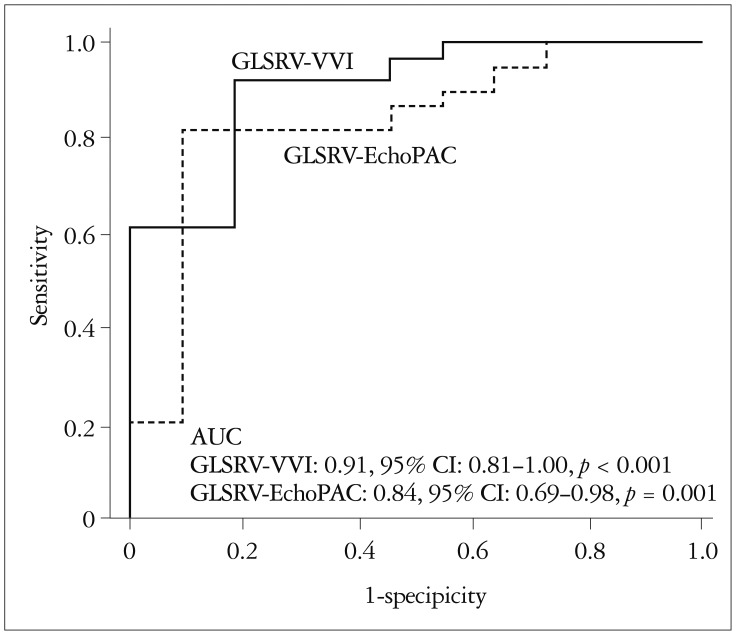
Fig. 4.
Receiver operating curve analysis in the detection of right ventricular (RV) systolic dysfunction (determined by an RV fractional area change < 35%). The global longitudinal strain of the right ventricle by velocity vector imaging (GLSRV-VVI) shows a larger area under the curve than does the global longitudinal strain of the right ventricle by automatic function image (GLSRV-EchoPAC). However, there is no statistical significance [difference = 0.07, 95% confidence interval (CI): -0.03-0.17, p = 0.188] in the detection of RV systolic dysfunction.

