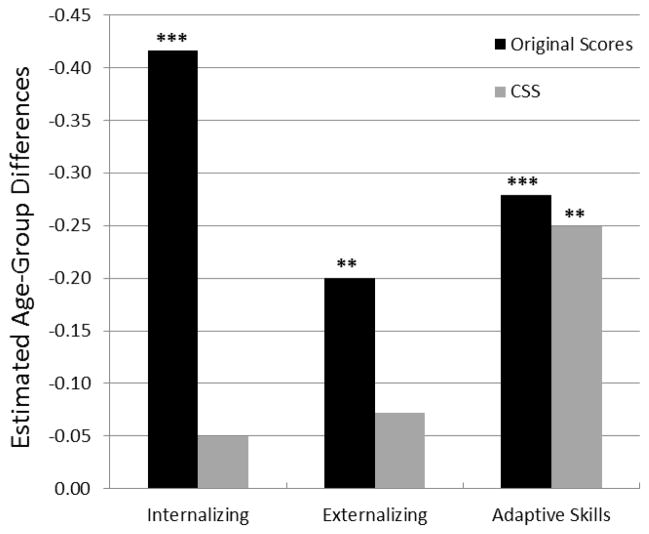
Figure 2. Estimated latent means on each PRS clinical index for the Adolescent sample using the original scores and CSS.
Values reflect estimates of the most restricted models (partial invariant models). Latent means of the child group (PRS-C) are fixed to 0. Child group (PRS-C), N = 161, Adolescent group (PRS-A), N = 200. ***p < .001, **p < .01,

