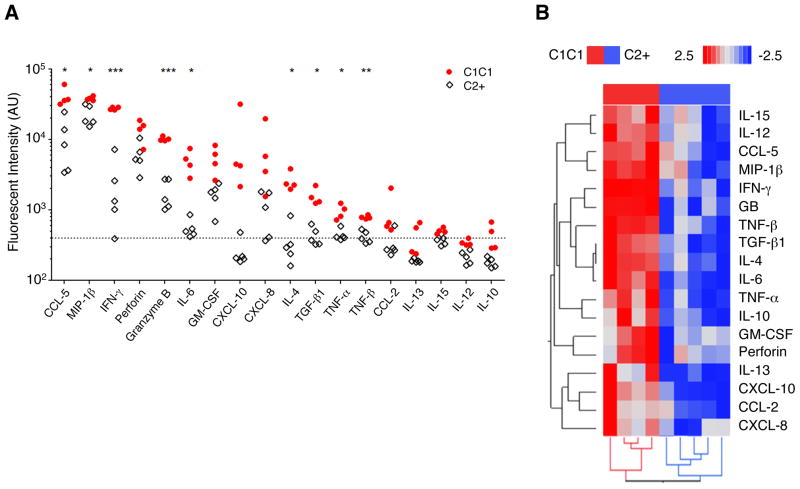
Figure 2. NK cells from HLA-C1C1 patients have distinct cytokine secretion patterns compared to those from HLA-C2+ patients in bulk culture.
(A) Univariate comparison of cytokine production level of bulk culture NK cells from HLA-C1C1 CD patients with (licensing, solid dot) and HLA-C2+ patients (unlicensed, open square) genotypes. The vertical axis shows the fluorescence intensity. (n = 4 to 5, P values are calculated using two tailed student t test, adjusted for multiple comparison by FDR, * p < 0.05; ** p < 0.005; *** p < 0.0005). The dash-line indicates the detection threshold. Secretion profiles were measured by multiplex ELISA. (B) Hierarchical clustering of the bulk cytokine production profile of NK cells from HLA-C1C1 (red) and HLA-C2+ (blue) CD patients. Each row represents one protein indicated on the right, and each column represents one patient. (n= 4 to 5).

