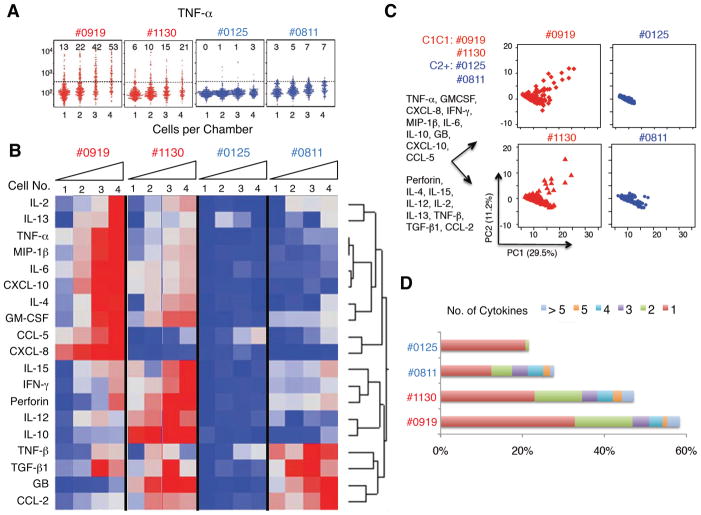
Figure 4. NK cells from HLA-C1C1 patients contain a subset of NK cells polarized for pro-inflammatory cytokines production.
(A) Univariate comparison of TNF-α production of NK cells from licensed (#0919, #1130, red) and unlicensed (#0125, #0811, blue) CD patients. The numbers in each graph indicate the percentage of microchambers that are positive for TNF-α signals. (B) Heatmap of cytokine secretion capacity for all the cytokines and all the CD patients analyzed. Each row represents one cytokine, and each column represents the percentage of microchambers that are positive for the cytokine. The color scale shows the difference in standard deviation. (C) PCA single NK cell measurements from the four CD patients. Percentage of variation explained by each component is shown in parentheses for each axis. The composition for each component is indicated on the left of the plots. (D) Bar graph of NK cell polyfunctionality. Different colors denote the percentages of single NK cells producing 1, 2, 3, 4, 5, or > 5 cytokines.

