
Figure 7. Supernatant of licensed NK cells drives human TH17 cells differentiation in vitro.
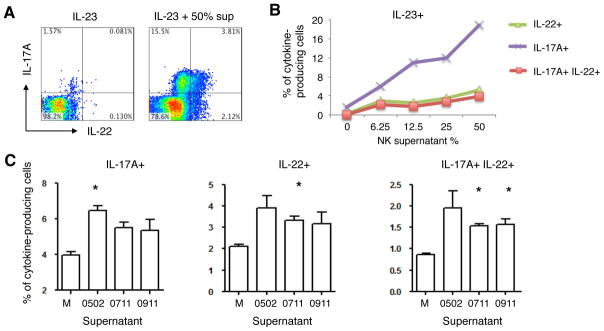
Freshly isolated CD4+ T cells were stimulated with anti-CD3 and anti-CD28, and cultured in the presence of indicated cytokine with or without licensed NK cell supernatants for 6–7 days. CD4+ T cells were expanded for another 6–7 days in 2 ng·mL−1 (26 IU) IL-2 with the same condition provided for priming. (A) 2D scatter plot of IL-17A and IL-22 intracellular production under the conditions indicated (gated on CD4+ cells). Numbers in each quadrant represents the percentage of cell in that quadrant. (B) Line plot of the abundances of IL-22+ (green triangle), IL-17A+ (purple cross), and IL-17A+IL-22+ (red square) populations at different amounts of NK supernatant. This result is representative of three independent experiments. (C) Bar plot of the percentages of IL-17A+ (left panel), IL-22+ (middle panel), and IL-17A+IL-22+ (right panel) CD4+ T cells after differentiating with 50% NK cell supernatants from three licensed healthy donors. M stands for media with the same amount of IL-2 used for NK three-day culture. All assays have been supplemented with 50 ng·mL−1 IL-23. (n = 2, two-tailed student t test, * p < 0.05). (0502 and 0911 are AA haplotype, 0711 has an extra KIR2DL2)