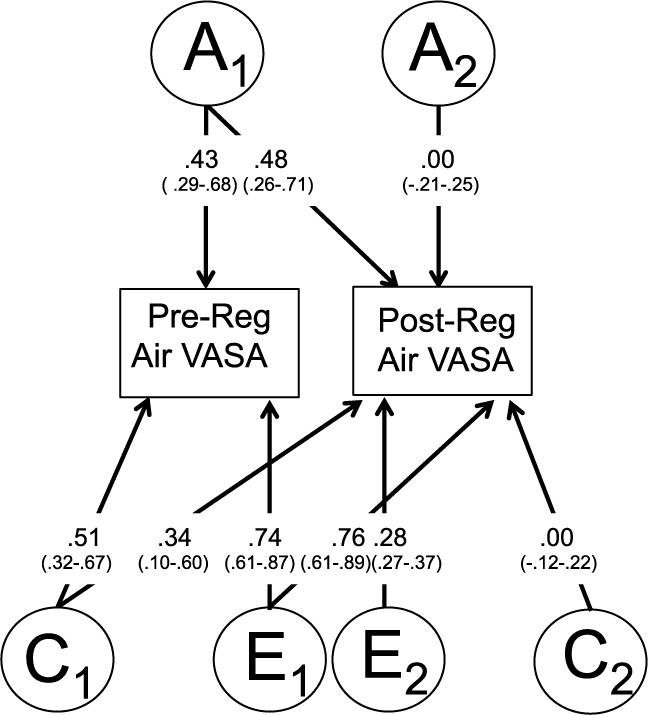
Figure 3.

Path estimates from the best-fitting bivariate Cholesky model for pre and post regular room air VASA scores, with 95% confidence intervals in parentheses. “A” represents additive genetic factors; “C” common shared environment; “E” represents nonshared environmental factors.
