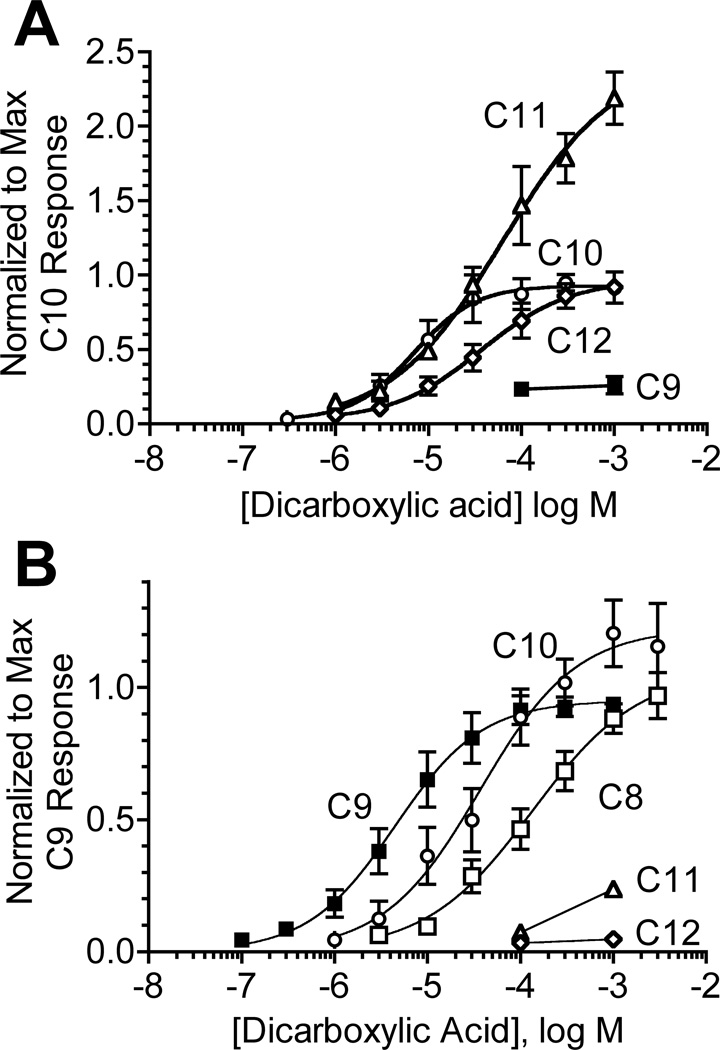
Figure 7. Dose-response analysis of MOR42-1 and MOR42-3.
A) Responses of MOR42-1 to a range of dicarboxylic acid concentrations. The dose-response curve for decanedioic acid (C10) was generated as described in Experimental Procedures. Responses to nonanedioic acid (C9), undecanedioic acid (C11) and dodecanedioic acid (C12) were normalized to the maximal response to decanedioic acid (see Experimental Procedures). Data are the mean ± SEM (n = 3–11). B) Responses of MOR42-3 to a range of dicarboxylic acid concentrations. The dose-response curve for nonanedioic acid (C9) is from Figure 3C. Responses to octanedioic acid (C8), decanedioic acid (C10), undecanedioic acid (C11) and dodecanedioic acid (C12) are normalized to the maximal response to nonanedioic acid (see Experimental Procedures). Data are the mean ± SEM (n = 3–12).

