
Figure 2. Loss of Shh leads to a shift in pancreatic tumor histopathology.
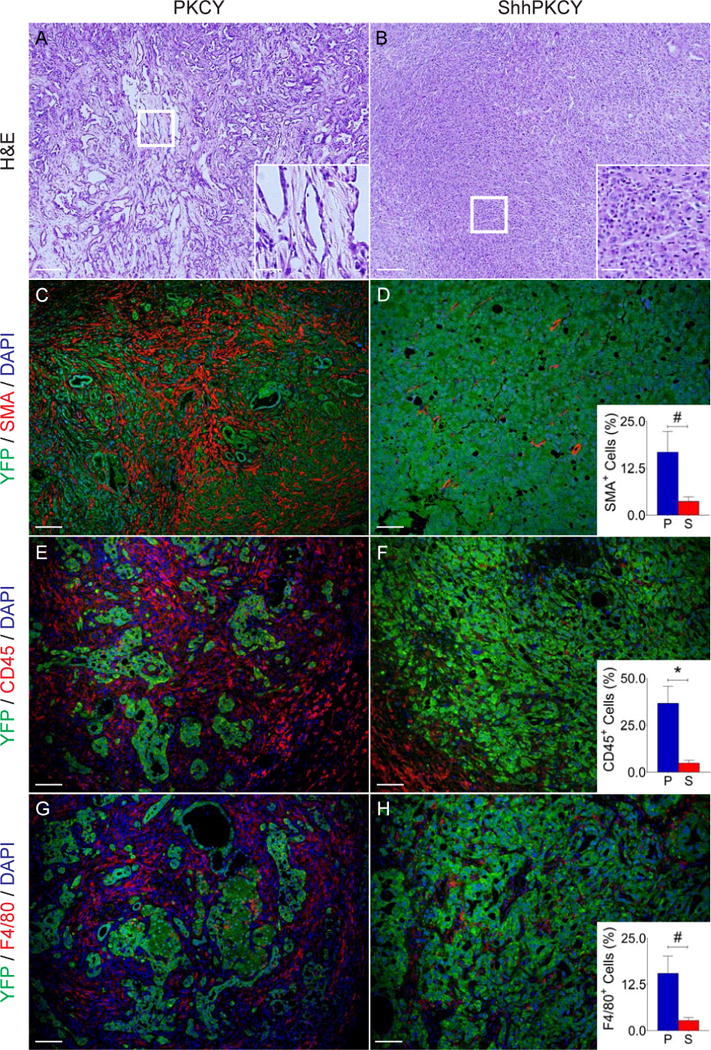
(A and B) H&E staining showing representative histology from PKCY (A) and ShhPKCY (B) tumors. Insets show higher magnified view of sections marked by the box.
(C–H) Multicolor immunofluorescence (IF) images of PKCY (left column) and ShhPKCY tumors (right column) assessed for myofibroblasts (C–D), total leukocytes (E–F), or macrophages (G–H).
(C and D) Fluorescent images showing staining with the pancreas epithelial lineage label YFP (green) and the myofibroblast marker alpha smooth muscle actin (SMA, red). Inset, quantitation of SMA+ cells as a percentage of all nucleated (DAPI+) cells within PKCY (blue) and ShhPKCY (red) tumors (n=3–5; #, p=0.016; bars represent mean +/− SD).
(E and F) Fluorescent images showing staining with YFP (green) and the pan-leukocyte marker CD45 (red). Inset, quantitation of CD45+ cells as a percentage of all nucleated (DAPI+) cells (n=3–5; *, p=0.0039; bars represent mean +/− SD).
(G and H) Fluorescent images showing staining with YFP (green) and the macrophage marker F4/80 (red). Inset, quantitation of F4/80+ cells as a percentage of all nucleated (DAPI+) cells (n=3–5; #, p=0.010; bars represent mean +/− SD).
Scale bars = 40 μm for larger images and 20 μm for insets.
See also Figure S2.