
Figure 3. Shh deletion results in greater vascular density and proliferation within pancreatic tumors.
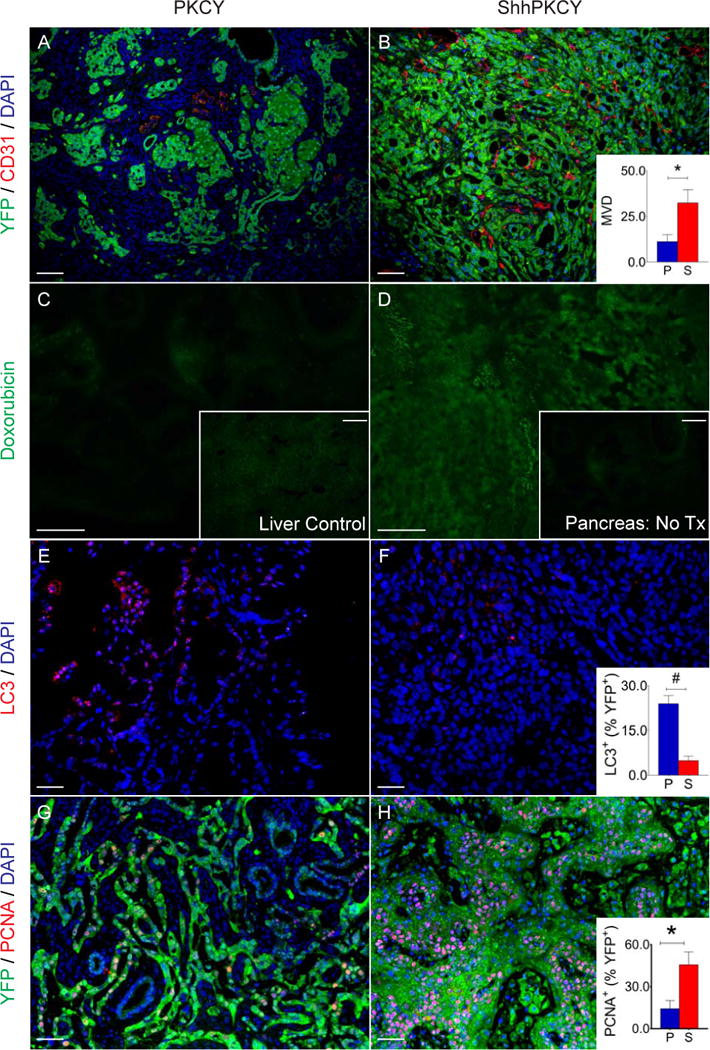
(A and B) Blood vessel density in PKCY and ShhPKCY tumors was determined by staining for the endothelial marker CD31 (red) and the tumor cell lineage marker YFP (green). Inset, measurement of mean vascular density within PKCY (blue) and ShhPKCY (red) tumors (quantified as number of CD31+ vessels per high powered field; n=3–5; *, p=0.004; bars represent mean +/− SD).
(C and D) Cellular perfusion in PKCY and ShhPKCY tumors was determined by intravascular delivery of the autofluorescent drug doxorubicin. Inset in C shows fluorescence of a liver section from the same PKCY mouse (positive control). Inset in D shows fluorescence of a ShhPKCY tumor injected with PBS (negative control).
(E–F) Autophagy in PKCY and ShhPKCY tumors was determined by staining for the autophagosomal protein LC3 (red). Inset, percentage of LC3+ cells within the YFP+ tumor cell population in PKCY (blue) and ShhPKCY (red) tumors (n=3–5; #, p=0.002; bars represent mean +/− SD).
(G–H) Proliferation in PKCY and ShhPKCY tumors was determined by staining for the cell cycle marker PCNA (red). Inset, percentage of PCNA+ cells within the YFP+ tumor cell population in PKCY (blue) and ShhPKCY (red) tumors (n=3–5; *, p=0.004; bars represent mean +/− SD).
Scale bars = 40 μm.