
Figure 7. VEGFR2 antagonism leads to selective inhibition of tumor growth in ShhPKCY mice.
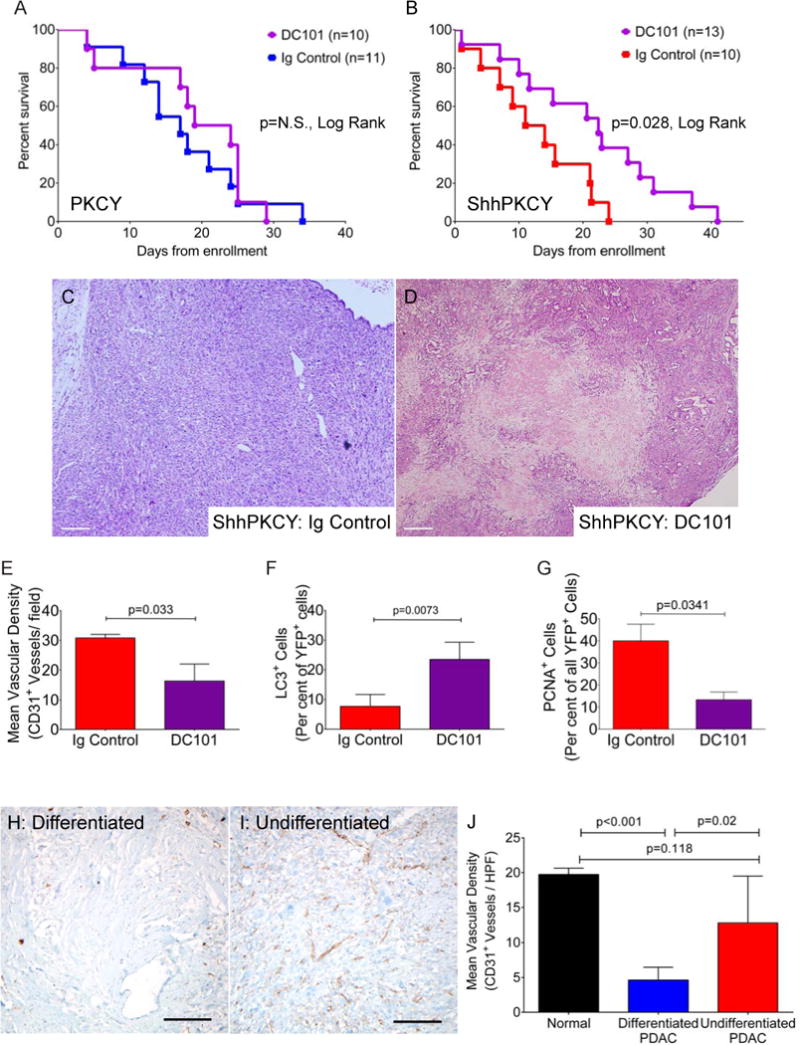
(A) Kaplan-Meier survival curve for tumor-bearing PKCY mice treated with bi-weekly DC101 (purple, n=10) or Ig control (blue, n=11).
(B) Kaplan-Meier survival curve for tumor-bearing ShhPKCY mice treated with bi-weekly DC101 (purple, n=13) or Ig control (red, n=10).
(C and D) H&E analysis of ShhPKCY tumors showing a large area of necrosis upon DC101 treatment (D). Scale bars = 250 μm.
(E) Quantification of CD31+ vessel density in ShhPKCY mice treated with DC101 compared to Ig control, depicted as mean (± SD) number of CD31+ vessels per high powered field (n=3–5).
(F) Quantification of YFP+ cells containing LC3+ autophagosomes in ShhPKCY mice treated with DC101 compared to Ig control, depicted as percentage (± SD) of YFP+ tumor cells exhibiting LC3 staining (n=3–5).
(G) Quantification of YFP+ cells staining with the proliferation in ShhPKCY mice treated with DC101 compared to Ig control, depicted as percentage (± SD) of YFP+ tumor cells that were PCNA positive (n=3–5).
(H and I) IHC for CD31 in differentiated (H) and undifferentiated (I) portions of human pancreas tumor A21. Scale bars = 200 μm.
(J) Mean vascular density of normal pancreas (n=3), differentiated human PDAC (n=5) and undifferentiated human PDAC (n=8). Bars represent p-values by two-sided Student’s t-test.
See also Figure S6.