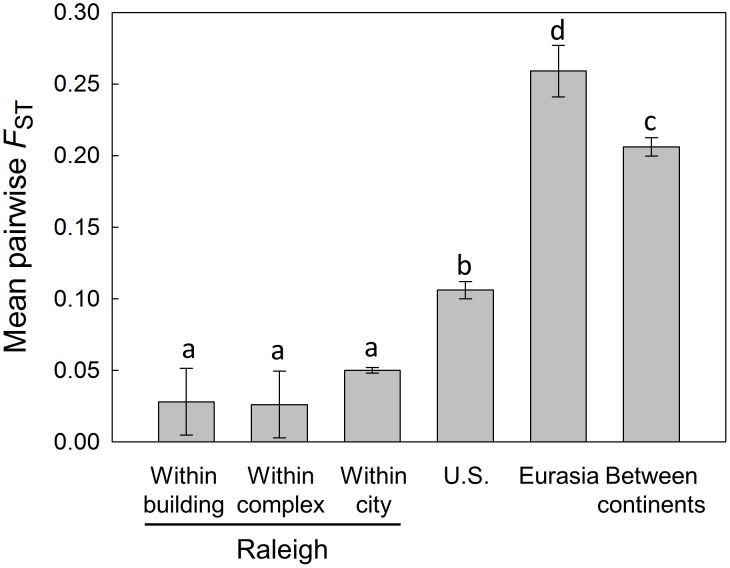
Figure 1. Levels of genetic differentiation among B. germanica populations at different spatial scales.
Shown are mean pairwise F ST values (±SE) for all pairs of populations at each level of analysis. The value for the U.S. consists of comparisons between cities in the continental U.S. (i.e., excluding Hawaii and Puerto Rico), including comparisons between Raleigh and other cities but excluding comparisons between apartments within Raleigh represented by only sample location DR-X. The value for “between continents” consists of all comparisons between populations in North America and populations in Eurasia. Bars labeled with different letters are significantly different (P<0.05).

