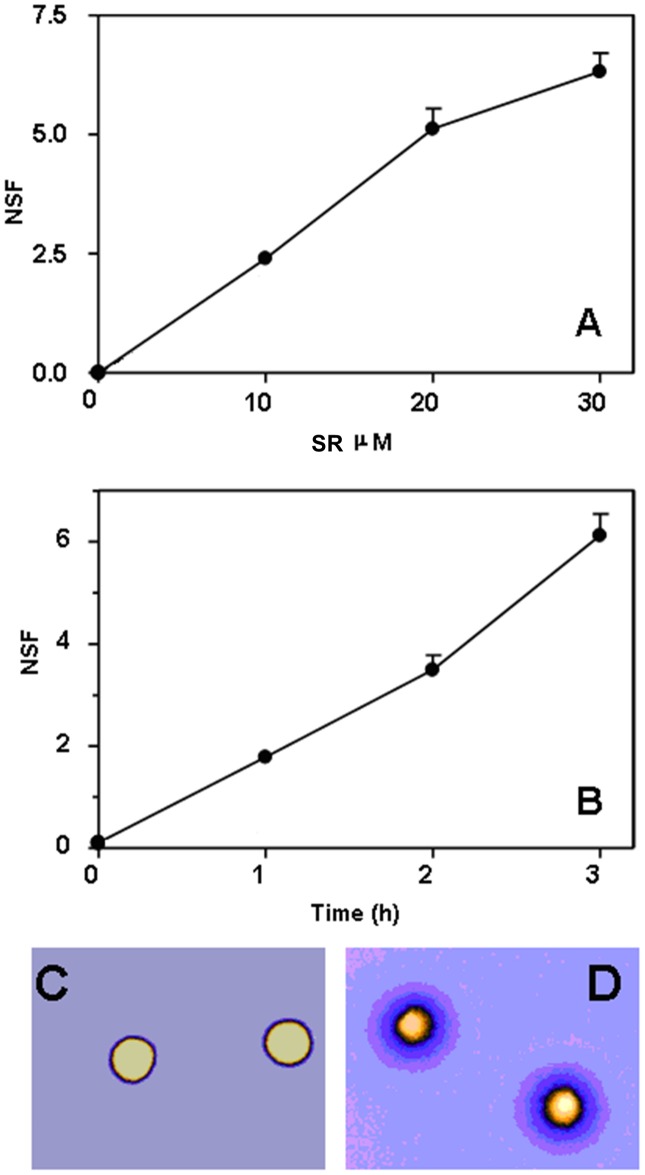
Figure 5. SR induces DNA damage in REH cells.
Cells were treated with increasing concentrations of, or for increasing time intervals with, SR and immediately assayed for DNA breakage with FHA. A) DNA single strand breakage induced by 3 h SR treatment in REH cells. B) DNA single strand breakage induced by 30 µM SR in REH cells as a function of incubation time. Data are presented as mean ± SEM of three different experiments. C) and D) Representative, digitally pseudocolored (ICA look up table of the Image J software) micrographs of FHA-processed control (C) or 30 µM SR-treated (D) REH cells are also shown: note the wide halos in D as compared to C. Also shown (panel A, inset) the extent of DNA double strand breakage caused by SR (30 µM for 3 h) or etoposide (1 µg/mL for 3 h) in REH cells. Data are expressed as NSF (nuclear diffusion factor), which represents the ratio between the total area of the halo and nucleus and that of the nucleus.

