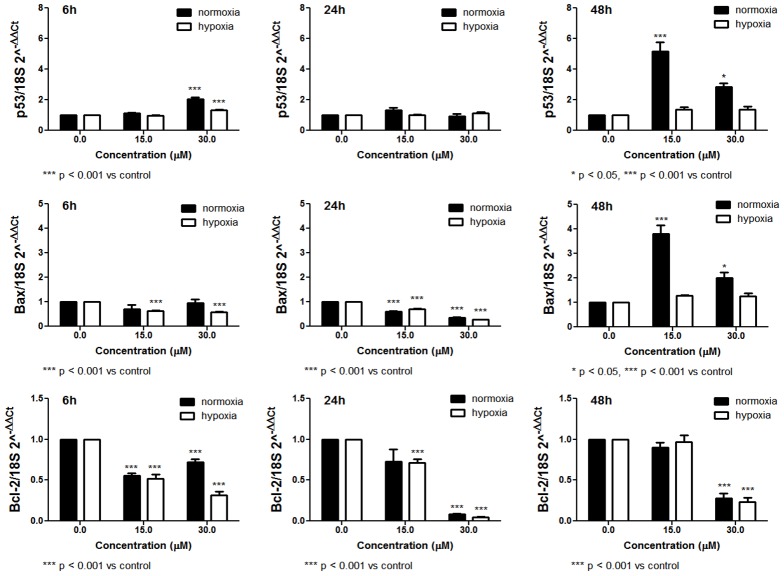
Figure 8. Effect of SR on p53, Bax and Bcl-2 mRNA relative expression calculated through the 2-ΔΔCt method and determined in normoxic and hypoxic conditions on REH cells.
Cells were treated with 0 to 30 µM SR for 6, 24 or 48 h. Data are presented as mean ± SEM of at least four different experiments.

