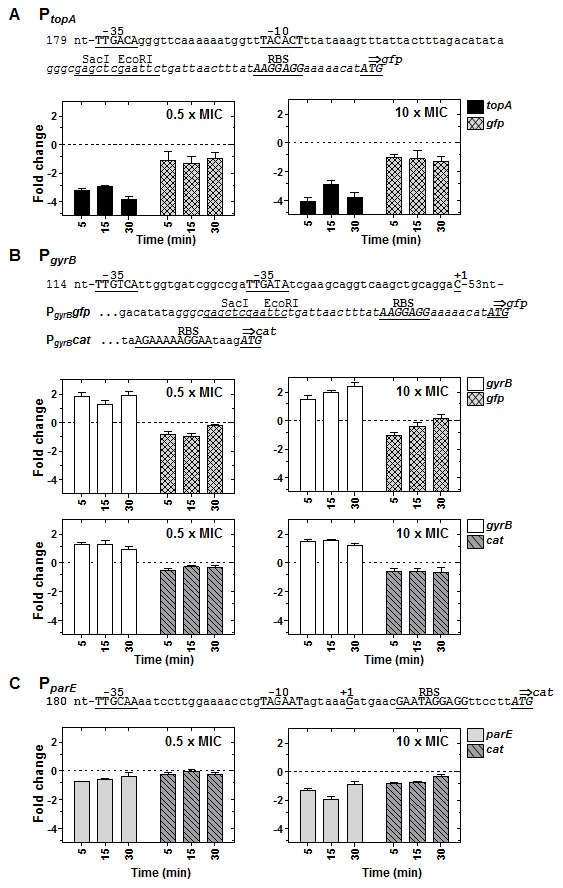
Figure 4. Relaxation-dependent transcription of PtopA and PgyrB is different in their chromosomal location and in a replicating plasmid and similar for PparE.

(A) A culture of R6 carrying a plasmid with a PtopAgfp fusion was grown until OD620nm = 0.4 and treated with novobiocin at 0.5× MIC and 10× MIC. Samples were processed as described in Figure 3. Results obtained from qRT-PCR analysis at the two novobiocin concentrations indicated are shown. (B) Results obtained with two cultures of R6 one carrying a plasmid with a PgyrBgfp fusion and the other a plasmid with a PgyrBcat grown and treated as in A. (C) Results obtained with a culture of R6 carrying a plasmid with a PparEcat fusion grown and treated as in A. The expression from the promoters in their chromosomal locations (topA, gyrB, parE) was also determined in the same cultures. Relative values (log2 mean of three independent replicates ± SEM) are represented. To normalize the three independent replicate samples, values were divided by those obtained from internal fragments of the 16S rDNA. These normalized values were made relative to those obtained at time 0 min. The nucleotide sequences of the promoter regions present in the plasmids carrying the fusions are indicated in each case. The −35 and −10 boxes, the +1 mRNA, the ribosome-binding site (RBS), and the ATG initiation codon are indicated in upper case and underlined. Letters in cursive are those present in the pAST vector used for cloning.
