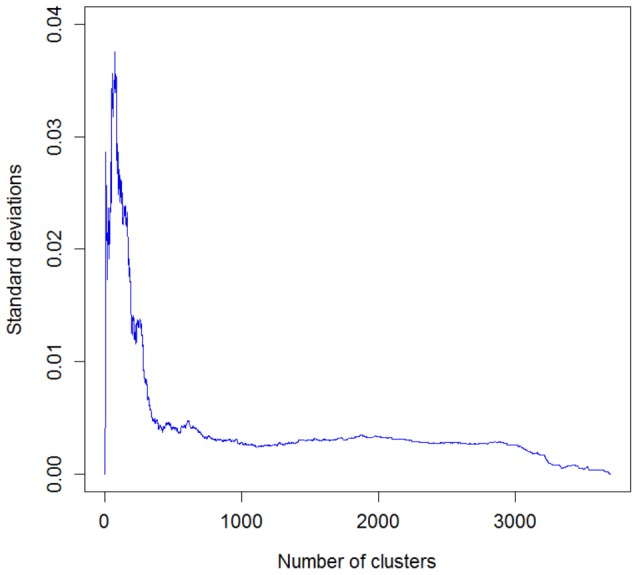
Figure 7. Standard deviations of Aci values collected for the 12 best combinations of hierarchical clustering parameters.

These combinations correspond to the highest mean Aci values over all possible cluster numbers. The maximum occurs for the cluster numbers between 50 and 80.
