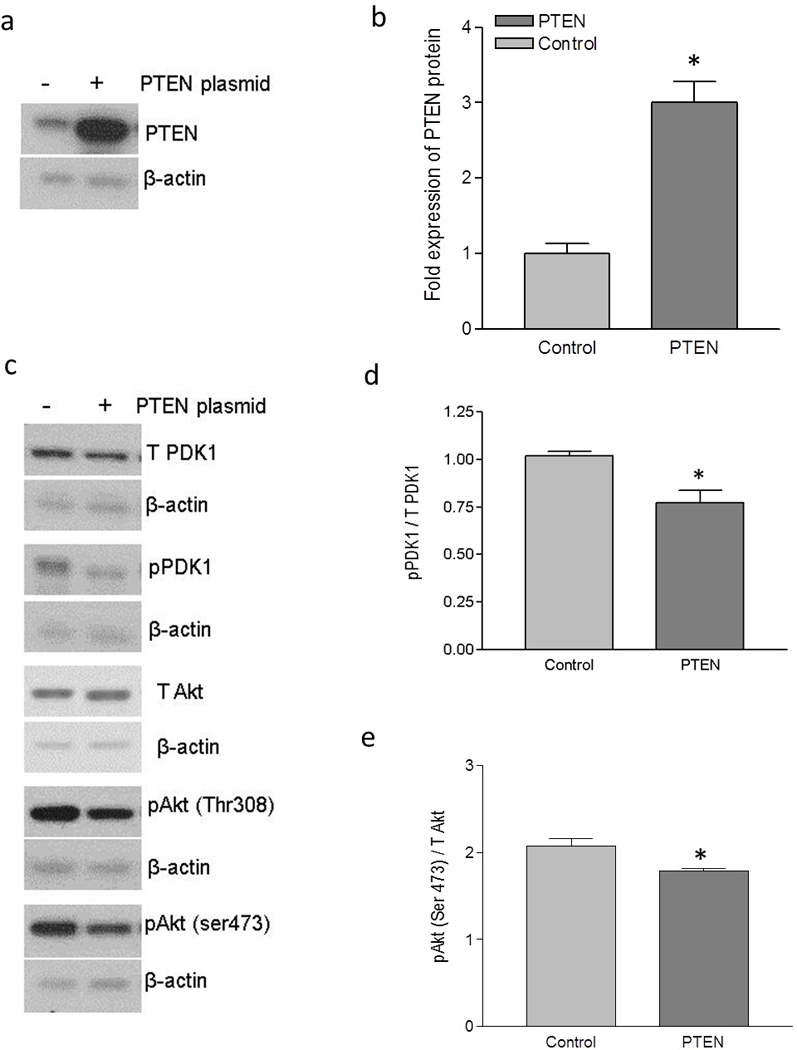
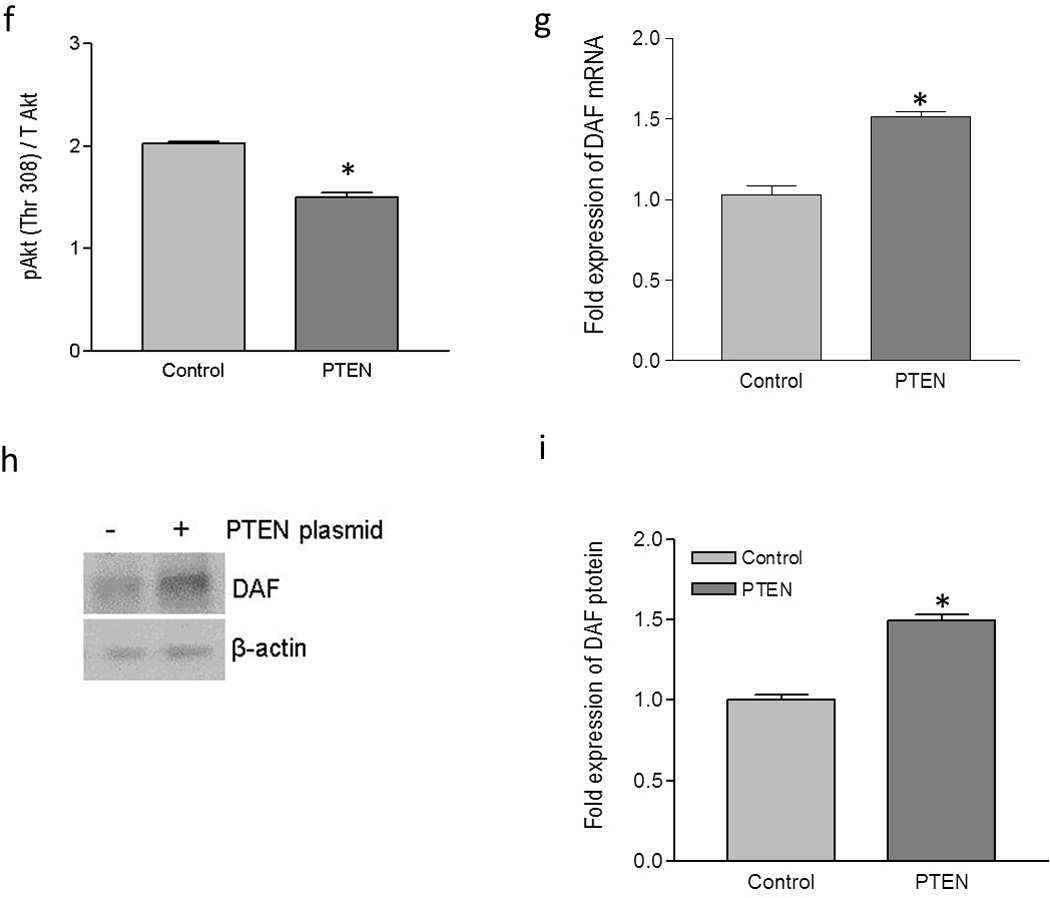
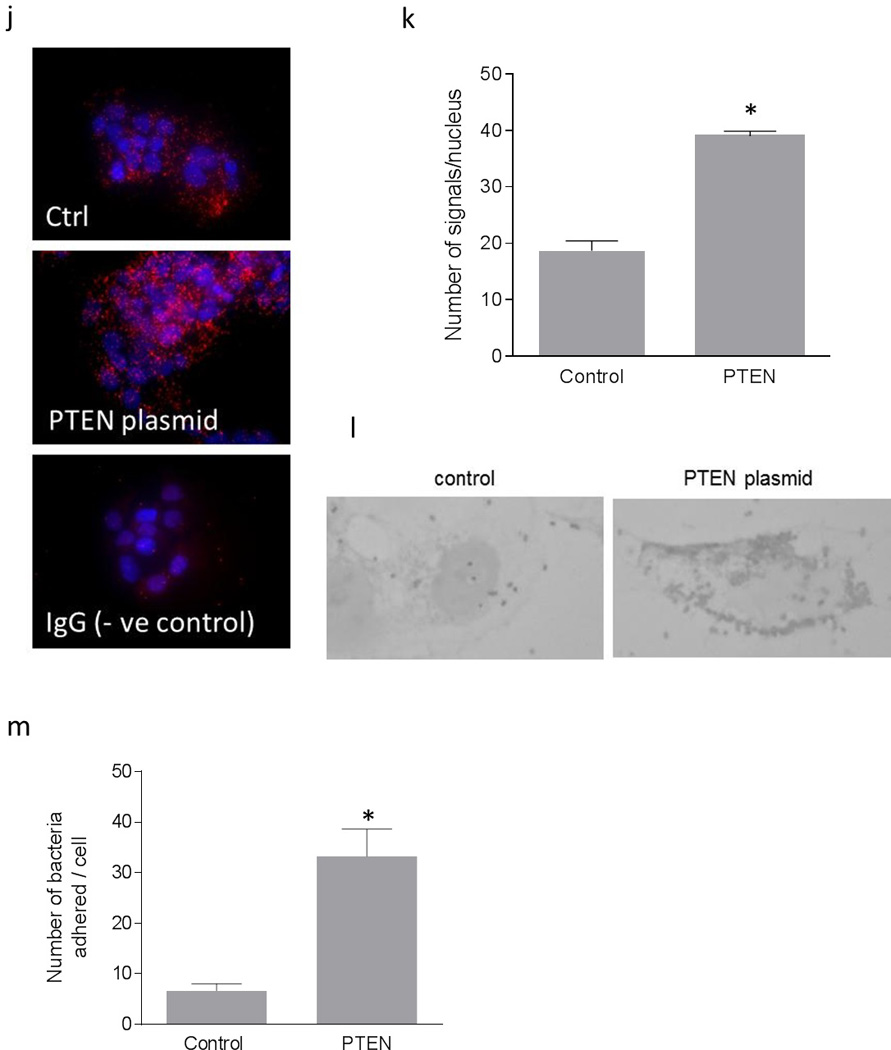
Figure 3.


Up-regulation of DAF and increase in Dr+ E. coli adhesion after the expression of PTEN in Ishikawa cells. Ishikawa cells were transiently transfected with plasmid encoding functional PTEN gene. For control, cells were treated with equivalent amount of transfection regent lipofectamine 2000. After 24 hours of transfection, cells were either lysed for western blot and real time qPCR or E coli. K-12 strain carrying plasmid pBJN406, encoding the production of Dr fimbriae was allowed to bind to the cells for 3 hours. The number of bacteria adhered per cell was counted after the gram staining. Similarly, Ishikawa cells sparsely grown on 16-well lab-Tek chamber slides were transfected as mentioned above, fixed using formalin and proximity ligation assay was performed. (a) Western blot for PTEN expression. (b) Density analysis of western blot indicating the fold increase in the PTEN protein expression. * p < 0.05 versus control. (c) Western blot for total PDK1, total Akt and their activated forms, pPDK1, pAkt(ser473) and pAkt(Thr308). (d) Western blot density analysis of pPDK1 protein levels expressed as ratio between pPDK1 and total PDK1. * p < 0.05 versus control. (e) Western blot density analysis of pAkt(ser473) expressed as ratio between pAkt(ser473) and total Akt. * p < 0.05 versus control. (f) Western blot density analysis of pAkt(Thr308) expressed as ratio between pAkt(Thr308) and total Akt. * p < 0.001 versus control. (g) Fold increase in DAF mRNA as assessed by real time qPCR. * p < 0.0001 versus control. (h) Western blot for DAF protein expression. (i) Density analysis of western blot indicating the fold increase in the DAF protein expression. * p < 0.001 versus control. (j) PLA assay for the expression of DAF protein on the surface of Ishikawa cells. (k) The DAF protein levels on the surface of Ishikawa cells as assessed by PLA assay, expressed as number of signals per nucleus. * p < 0.01 versus control. (l) The adherence of E. coli K-12 strain carrying the plasmid pBJN406 to the Ishikawa cells as revealed by gram staining. (m) The average number of bacteria adhered per cell. * p < 0.01 versus control. Data are representative images or expressed as mean values ± SEM of each group from three separate experiments.
