Figure 2. Examples of the overlap pitfall: non-independence of discovery and validation samples.
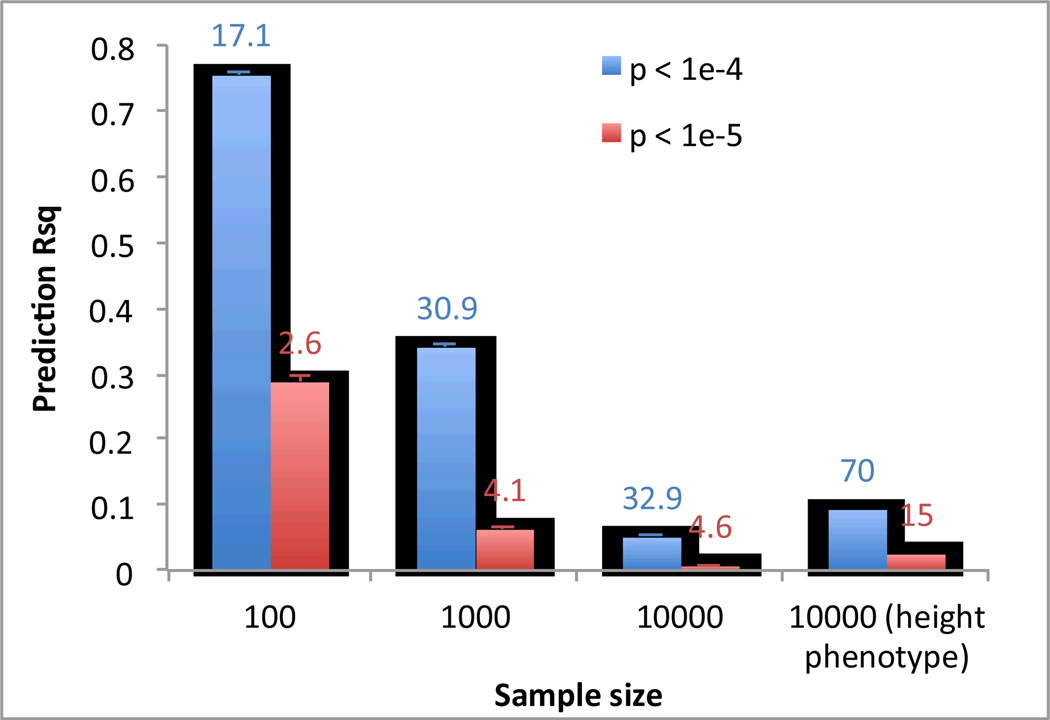
a) Human: High R2 can be achieved by chance particularly when sample size is small.
We simulated GWAS data based upon real human genotype data under the null hypothesis of no association. We used data of 11,586 unrelated European Americans genotyped on 563,212 SNPs 71–73. We randomly sampled N individuals and selected top SNPs for height at p < 10−5 (red bar) and p < 10−4 (blue bar) to predict the phenotype in the same data. We also performed association analysis for real height phenotype in 10,000 individuals and selected top SNPs at p < 10−5 (green bar) and p < 10−4 (purple bar) to predict height phenotype in the same sample. The graph shows the mean prediction R2 over 100 simulation replicates. Error bar: standard error of the mean. The number on top of each column is the mean number of selected SNPs over 100 simulation replicates.
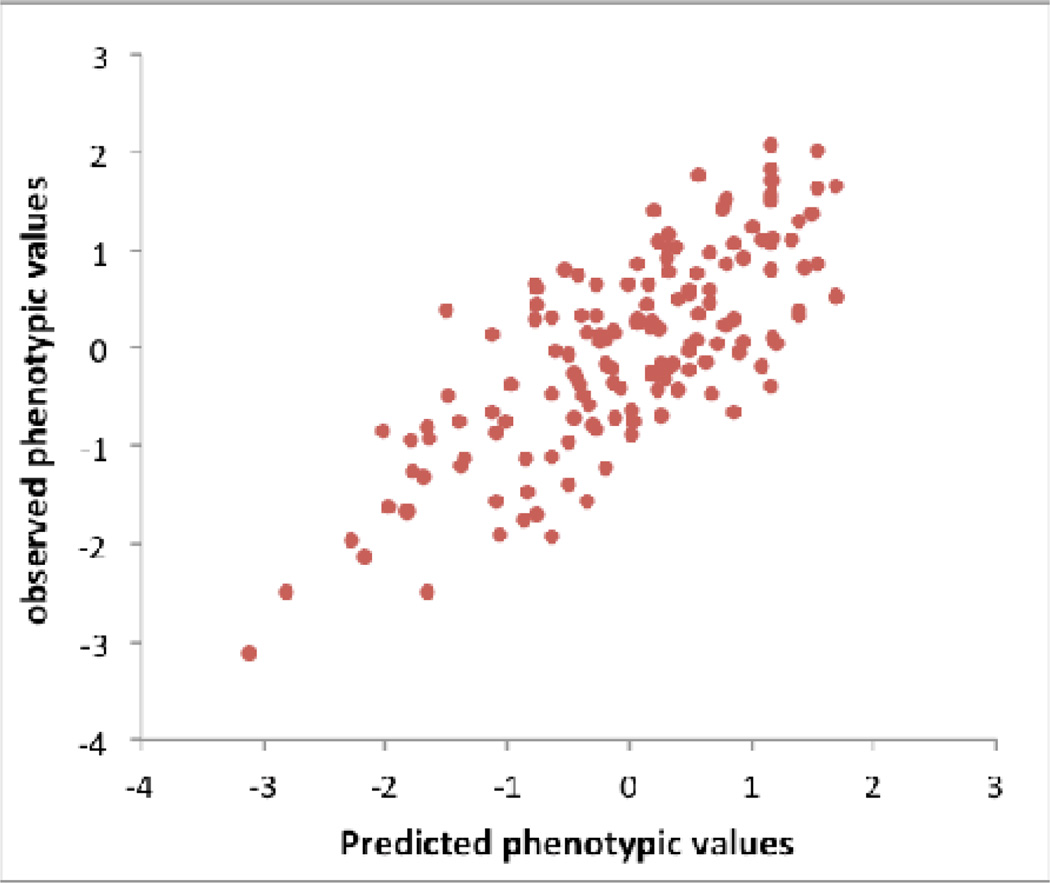
b) Drosophila: An example, illustrating bias when selecting the top SNPs. We downloaded genotype data of the Drosophila Genetics Reference Panel and simulated phenotypes under the null hypothesis, i.e., random association between each of the > 1 million SNPs and phenotype. We repeated the GWAS analysis reported in54, selecting the top 10 independently associated SNPs and predicted the phenotypes of the lines using these 10 SNPs. Since in the simulated data there are only random associations between SNP and phenotype any prediction power is false and result of over-fitting. By chance, the top SNPs (in terms of test statistic) explain 57% (R2=57%) of the phenotypic variance between the inbred lines, from a linear regression of phenotype on predictor. Both phenotype and predictor have been standardized to normal distribution z-scores (mean of zero and standard deviation of one).
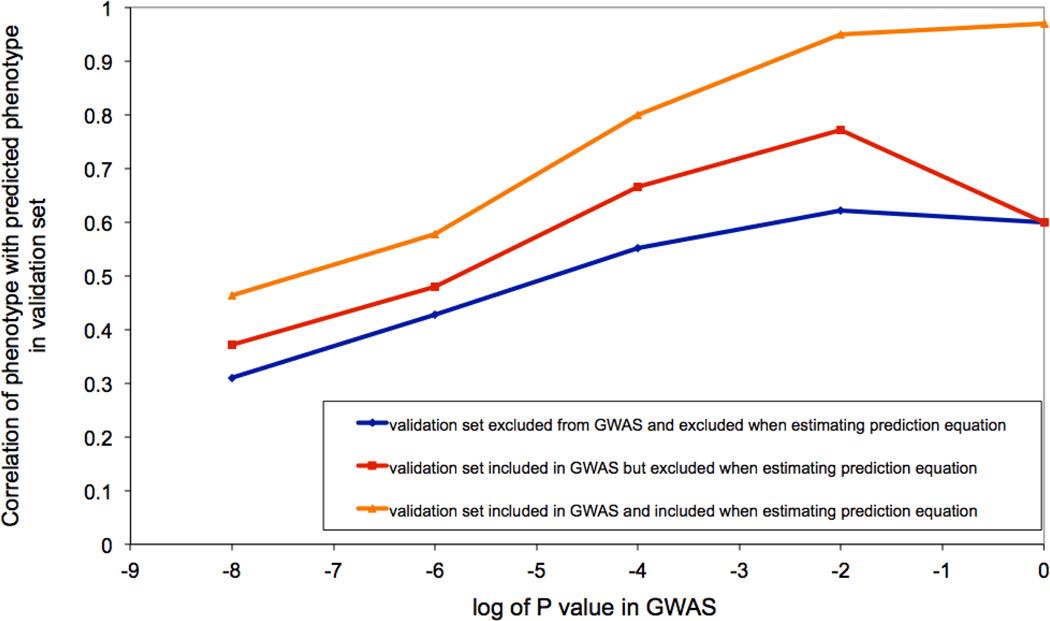
c) Dairy Cattle: The impact of leaving the validation cohort in the discovery set, either at both SNP selection (GWAS) and SNP effect estimation stages, or at the effect size estimation stage only. Data shown are from 2,732 bulls with ~500K SNPs phenotyped for average milk yield of their daughters’ milk production. The bulls were split into a discovery sample (bulls born during or before 2003), Nd = 2,458, and a validation sample (bulls born after 2003) of Nv= 274.


