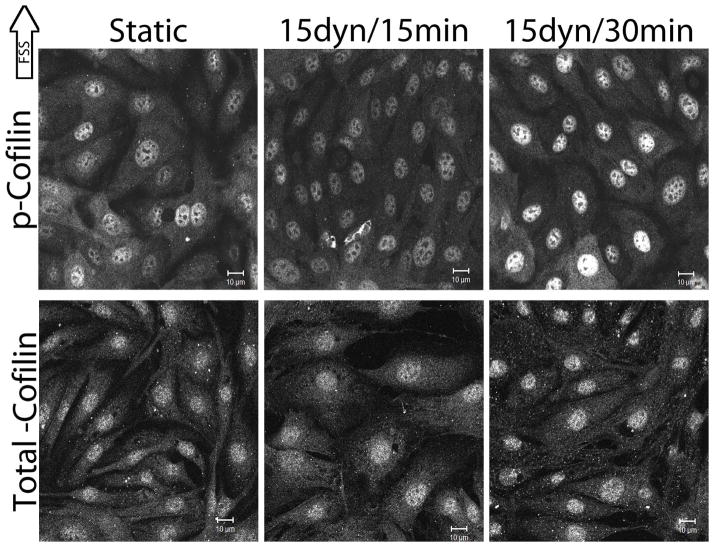
Figure 1.
FFS-induced changes in cofilin phosphorylation.
Confluent monolayers of BAECs were exposed to 15dynes/cm2 FSS for 15 and 30 mins. BAECs were labeled with antibodies against p-cofilin (top panel) or total cofilin (bottom panel) (Santa Cruz Biotechnology). Gain intensity was set just below saturating levels for the static p-cofilin and total cofilin separately and those settings were used to image the remaining slides within the replicate for each protein. Image analysis was performed as described in the methods. Images shown are representative of at least 3 replicates. Scale bars = 10μm.

