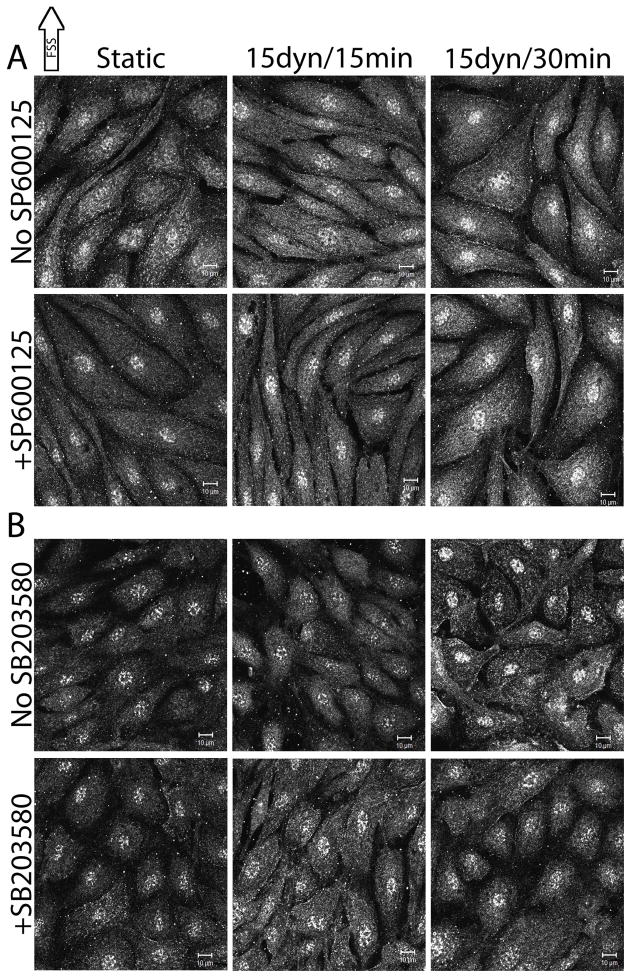
Figure 5.
FSS-induced changes in SSH phosphorylation
Confluent monolayers of BAECs were exposed to 15dynes/cm2 FSS for 15 and 30 mins and labeled with antibodies against pSSH (serine- 978). Image analysis was performed as described in the methods. The images shown are representative of at least 3 repeats. [A] SP600126-treated BAECs. [B] SB203580-treated BAECs. Scale bars = 10μm.

