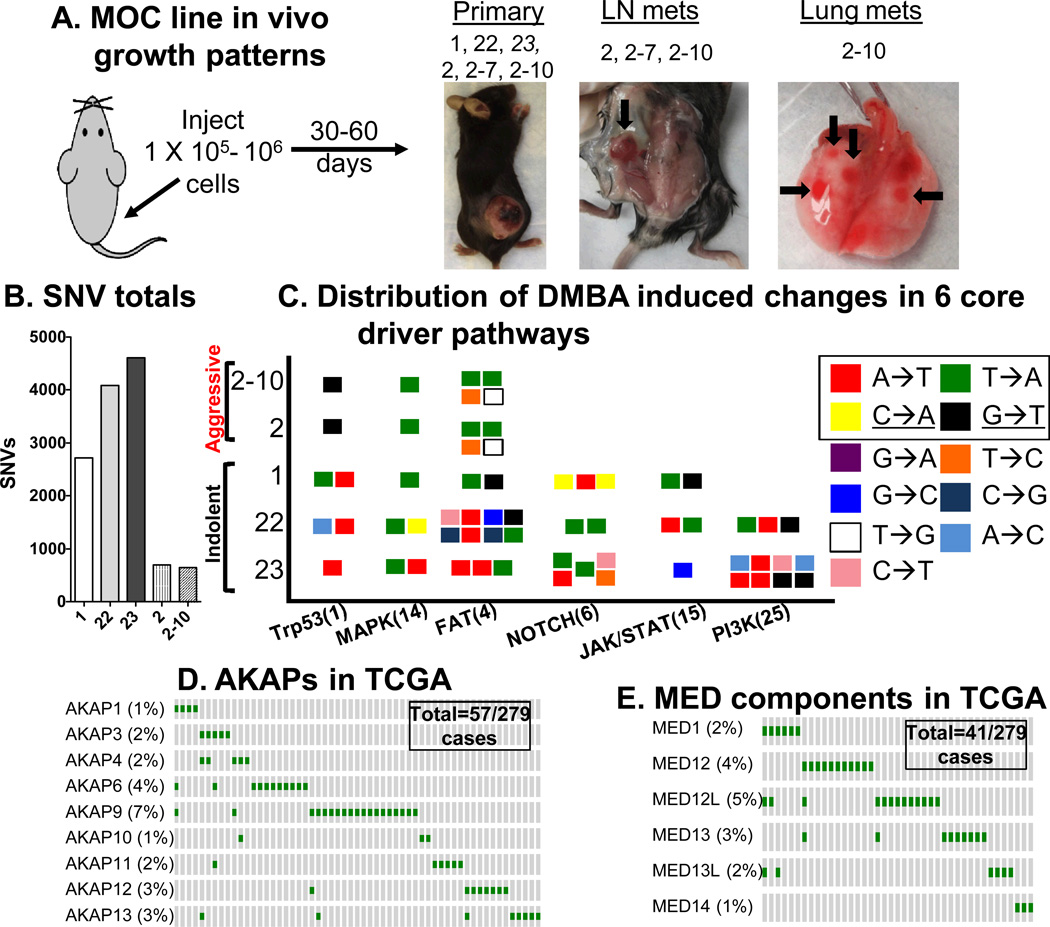
Figure 1.
Next generation sequencing analysis of MOC cell lines (A) Overview of MOC cell line model illustrating biologic behavior upon flank injection of cells. Note MOC23 (italicized) only grows in RAG2−/− mice, (B) Number of SNVs in each MOC line, (C) Distribution of DMBA induced changes in 6 core driver pathways of HNSCC shown as a “signal flag” plot of mutation subtypes in the indolent and aggressive cell lines (numbers of genes in each driver pathway in parentheses). The boxed nucleotide changes (A→T, T→A, C→A and G→T) represent the most common DMBA induced alterations. Note, the underlined G:C→T:A change is typical for tobacco-induced mutations (11). (D) Selected Oncoprint of mutation rates within the TCGA cohort for AKAP proteins showing that 57/279 patients have alterations in indicated AKAPs. (E) Oncoprint for MED proteins showing that 41/279 patients have alterations in indicated MED components.

