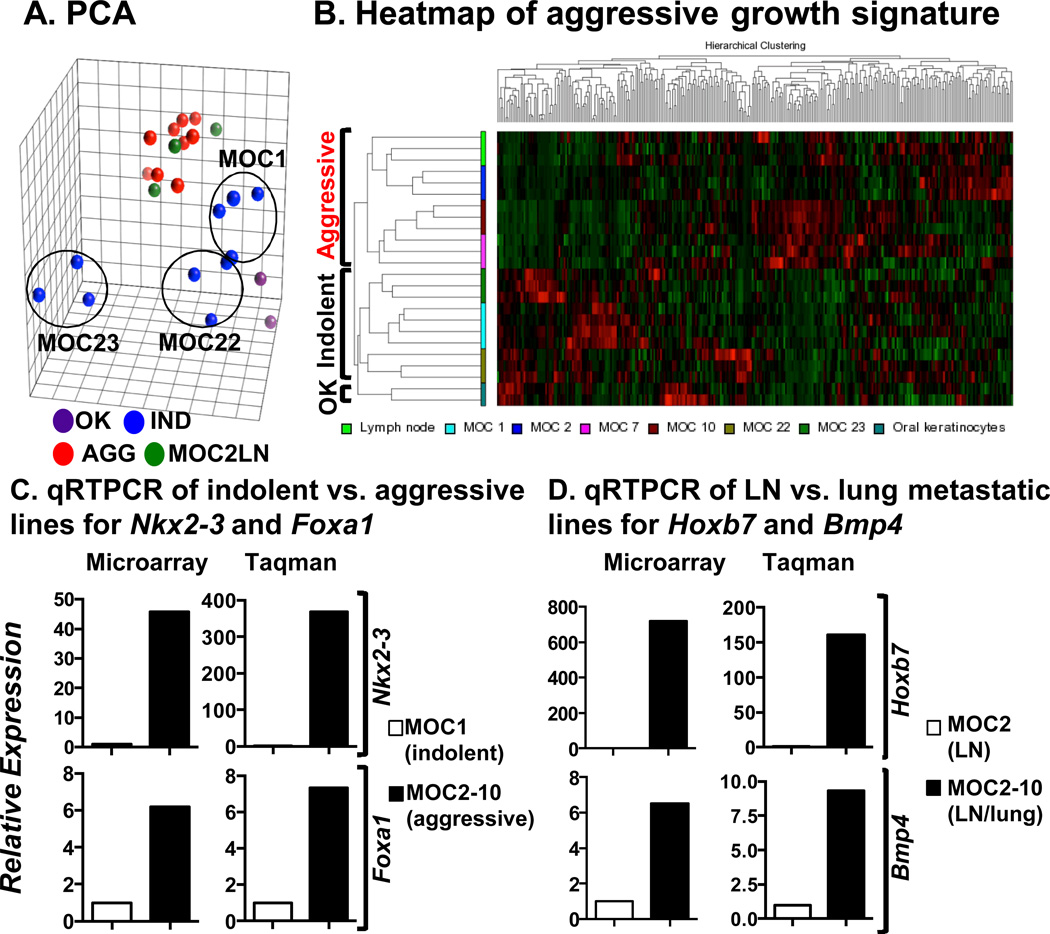
Figure 2.
Expression microarray analysis of MOC lines identifies a metastasis signature conserved in human OSCC (A) Principal component analysis (PCA) of MOC lines shows clustering of MOC1 and MOC22 near oral keratinocytes (OK). MOC23 is separated from all lines whereas the related aggressive lines all cluster together. (B) Unsupervised clustering of microarray data reveals a mouse signature of metastasis. (C) Microarray values (MA) and qRT-PCR analysis (Taqman) for Nkx2–3 and Foxa1 in MOC1 (indolent) and MOC2–10 (aggressive) lines showing dramatic upregulation in the aggressive line. (D) Hoxb7 and Bmp4 expression in MOC2 (LN-lymph node metastatic) and MOC2–10 (LN/lung metastatic).

