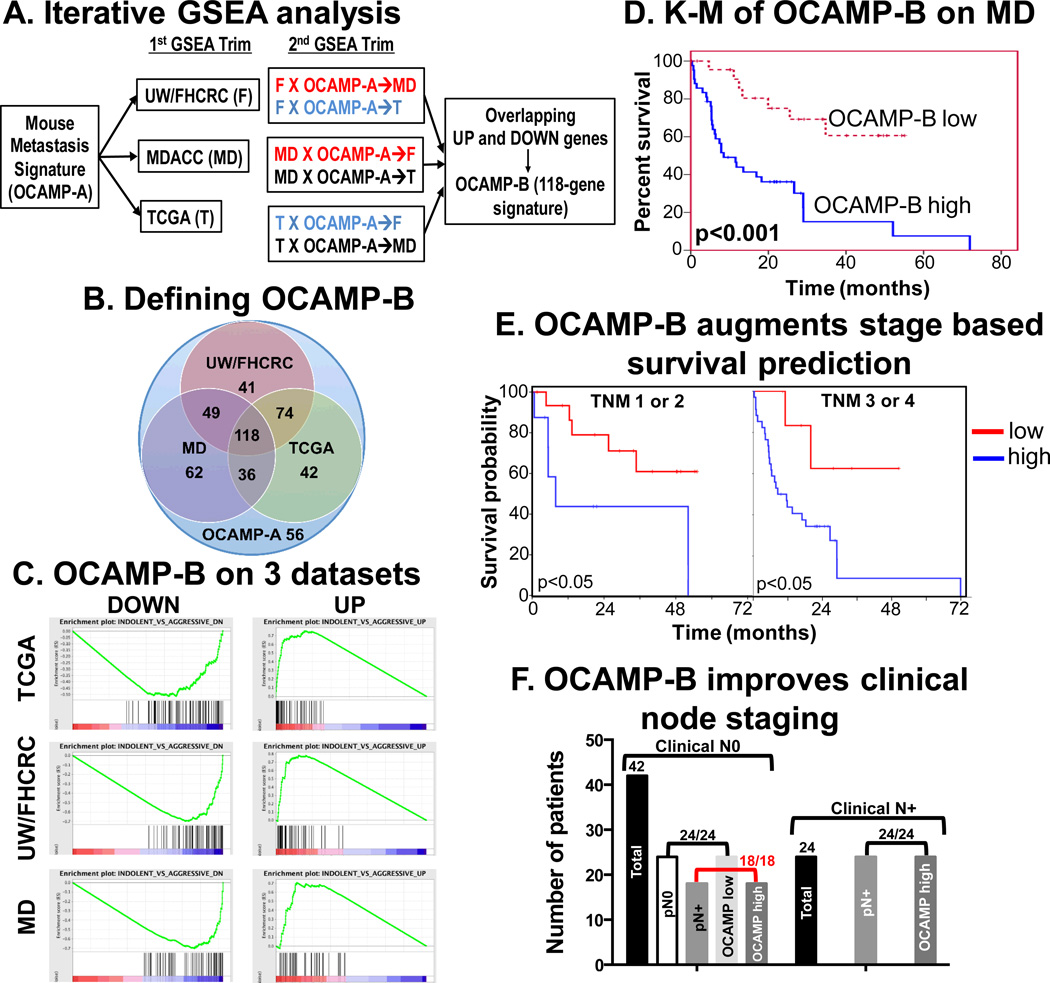
Figure 4.
Derivation of OCAMP-B by enrichment analysis (A) Schematic of iterative GSEA showing selection of enrichment in each dataset (1st trim) and tandem enrichment in a 2nd trim that finally yields the 118-gene OCAMP-B signature. (B) Venn diagram of OCAMP-A enrichment on three datasets with 118 common genes defined as OCAMP-B. Note that 56 OCAMP-A genes did not enrich in any dataset. (C) Final GSEA on all three human datasets using OCAMP-B. (D) Kaplan-Meier analysis after OCAMP-B based weighted voting of MD dataset showing significant overall survival differences (p<0.001). (E) Kaplan-Meier analysis of MD dataset by stage compared to signature-based assignment (p=0.043 for Stage I/II and p=0.033 for Stage II/IV). (F) OCAMP assignment and pathologic node status are equivalent and importantly 18/18 patients who were cN0 but were pN+ were correctly identified.

