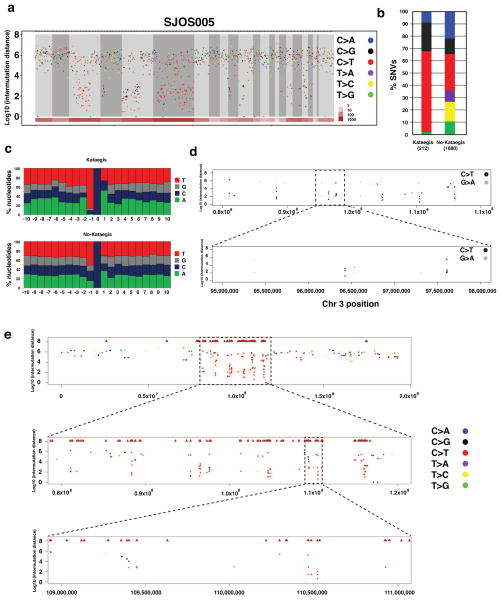
Figure 2. Kataegis in osteosarcoma.
a) Rainfall plot showing the Log10 of the intermutation distance versus genomic position for a representative osteosarcoma sample (SJOS005) with evidence of Kataegis. The chromosomes are demarcated by gray shading and the number of SVs in each chromosome is shown in brown at the bottom. The validated SNVs are plotted and color coded by the type of mutation. b) The proportion of each type of validated SNV in osteosarcomas with evidence of kataegis versus those without kataegis. c) The distribution of each nucleotide sequence 5′ to the C mutations in tumors with kataegis and those without kataegis. d) A rainfall plot in a representative regions of chromosome 3 in SJOS005 with kataegis showing the strand of the hypermutation based on the C>T or G>A sequence clusters. f) A macrocluster of hypermutation with evidence of kataegis on chromosome 3 of SJOS005 with two sequential magnifications (boxes) showing the existence of microclusters within a single macrocluster.

