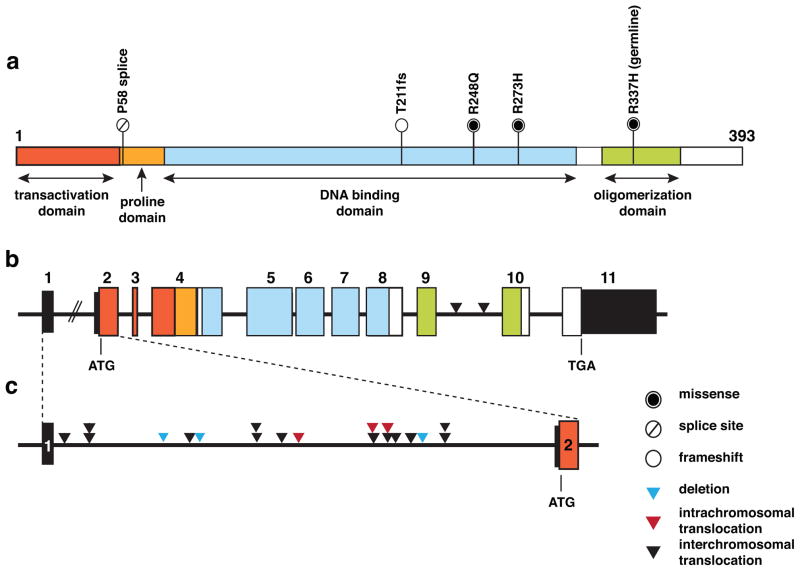
Figure 3. Validated mutations in TP53.
a) Structure of the TP53 gene showing the transactivation, proline, DNA binding and oligomerization domains with splice site, frameshift and missense mutations in the 19 patient’s tumors in the discovery cohort. b) Structure of the genomic locus of the TP53 gene showing the exon boundaries color coded in accordance with the protein domains shown in (a). Sites of interchromosomal translocations are shown with black arrowheads between exons 9 and 10. The sizes of the introns and exons are scaled proportionally except for intron 1, which is much larger than the other introns in human TP53. c) A magnified view of intron 1 of TP53 showing the deletions (blue arrowheads), intrachromosomal (red arrowheads) and interchromosomal translocations (black arrowheads).

