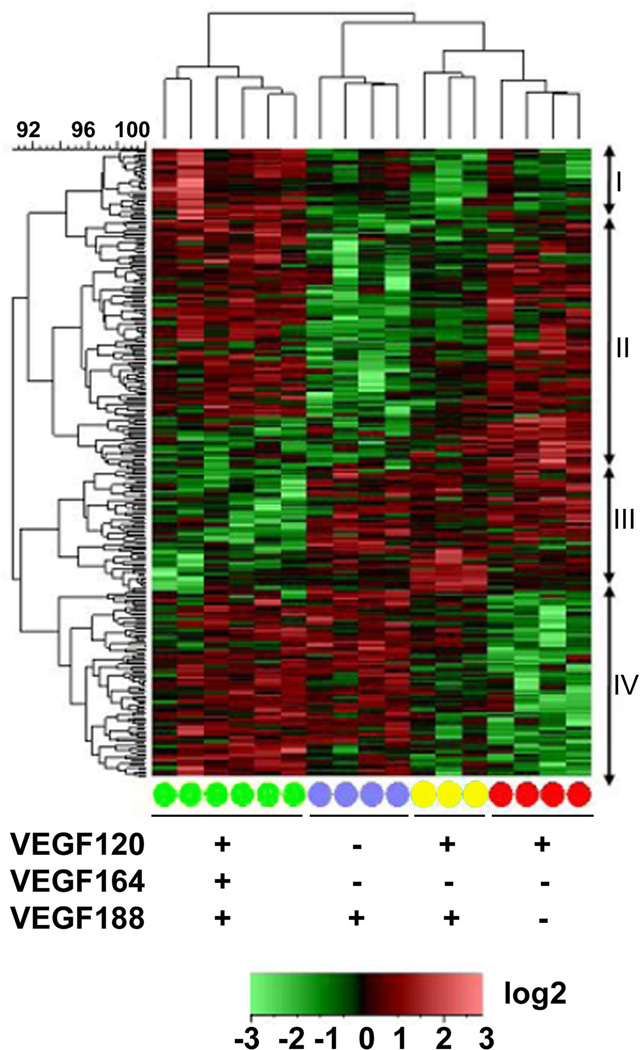
Figure 1. Transcriptional profiling of embryonic forebrains from E9.5 Vegf isoform mice reveals differential expression patterns for single versus dual expressing isoforms.
Differentially expressed genes from Vegf188 (blue circles), Vegf120/188 (yellow circles), and Vegf120 (red circles) E9.5 forebrains were compared to wild type (green circles) samples using the Affymetrix mouse genomic chip 430.2 array. The log2-transformed PLIER values were row mean centered and the Complete Linkage algorithm, based on a Euclidean Distance similarity metric, was used to generate the heatmap for relative signals. Differentially expressed genes were identified based on a Log2 fold-change ≥ 0.5 and ANOVA p-value ≤ 0.05. The individual genotype samples were clustered based on a Pearson Correlation. Vegf120/188 (yellow, n=3) forebrain transcriptomes were clustered between the Vegf120 and Vegf188 transcriptomes, implying that the Vegf120/188 expression profile differs significantly from wild type (green, n=6) and was more closely related to the other Vegf isoform mice. The Vegf120/188 transcriptome phenotype appears to be a combination of the Vegf120 (red, n=4) and the Vegf188 (purple, n=4) transcriptomes, indicating that the presence of both a diffusible and non-diffusible isoform is not sufficient to rescue the wild-type transcriptome phenotype in the absence of the primary Vegf164 isoform. Cluster I shows increased expression in the wild type mice compared to the three isoform mice (32 probe sets). Cluster II showed a general decrease in expression in the Vegf188 and Vegf120/188 mice (111 probe sets). Cluster III showed a decrease in gene expression among the wild-type mice (55 probe sets). Cluster IV showed a decrease in expression amongst the Vegf120 and Vegf120/188 mice (83 Probe sets). Presence (+) or absence (−) of a Vegf isoform in a particular group is indicated below the heat map. Annotated gene information can be found in Supplemental Table 2.

