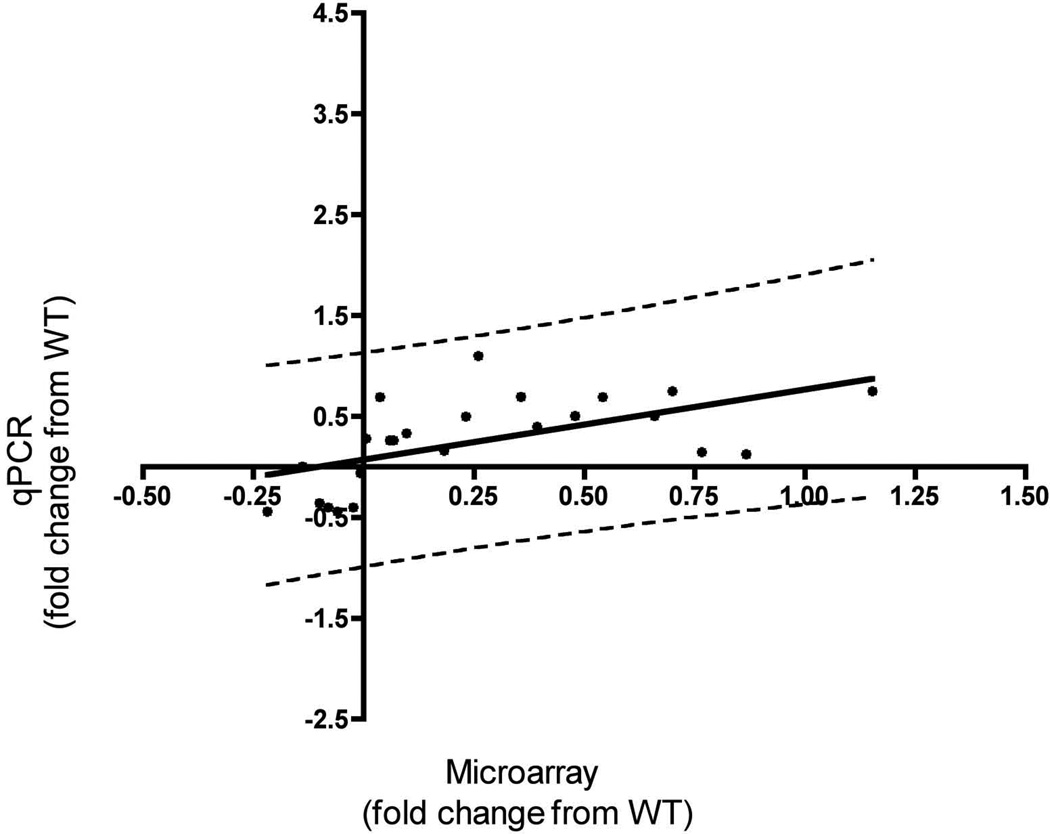
Figure 4. qPCR confirmation of the meta-array analysis.
qPCR was conducted for 7 genes and the Log2 fold change between wild type and individual Vegf isoforms (Y-Axis) was plotted against the Log2 fold change of their corresponding microarray probe expression values (X-Axis). The scale on both axes is Log2. The solid black line represents the regression line (m = 0.71) and the dashed lines indicate the 95% confidence intervals. These latter values were used to remove outliers. We ran a Spearman correlation analysis on 24 (black circles) of the 27 pairs and obtained a positive r-value of 0.693 (p < 0.0002). Quantification and statistical analysis of the qPCR runs can be found in Supplemental Table 4.

