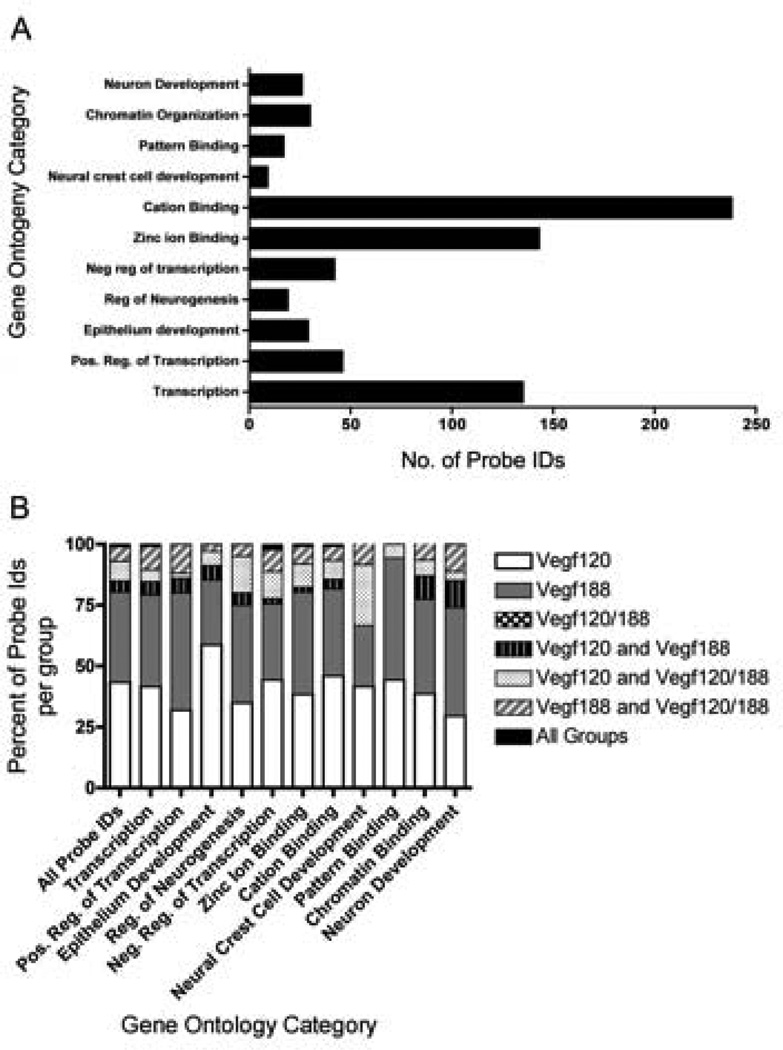
Figure 5. Enriched Gene Ontology Categories in Vegf isoform mice.
DAVID analysis identified GO categories that were overly represented amongst the differentially expressed genes. Affymetrix probe identification numbers (Ids) of DEGs that were detected as significantly changed by BAMarray in the Vegf120, Vegf188, and Vegf120/188 microarray meta-analyses were uploaded as a single list into DAVID. Functional Annotation Clustering was run on the high setting with the Bonferroni adjustment and GO Terms with an Enrichment Score within a range of 2 to 6 and p-values less than 0.01 were reported. 417 unique differently expressed genes were identified by DAVID with GO categories that were statistically over-represented. The bar graphs represent the number of probe Ids for each functional category. Specific probe Ids, as well as, the DAVID statistics are located in Supplemental Table 5 (A). The gene contribution from each group of Vegf isoform mice into the various GO categories were broken down into their relative proportions. Of these genes roughly 40% were found changed in either the Vegf188 mice only, or Vegf120 mice only. No genes were identified by DAVID as being unique to the Vegf120/188 mice (B).

