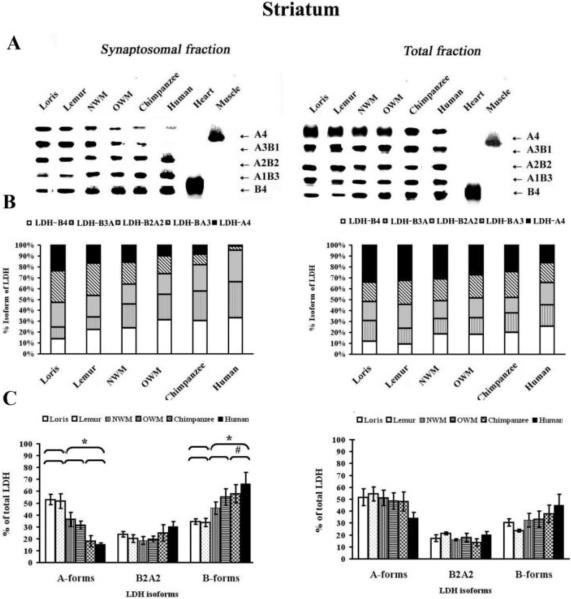
Figure 4.
LDH isoenzyme patterns from the synaptosomal striatal fractions and total homogenates. A) Representative zymogramms from two fractions, synaptosomal and total homogenates isolated from the primate striatum. LDH isoenzyme tetrameric composition (right side) indicates the number of A (anaerobic) and B (aerobic) subunits that constitute each isoenzyme. Quantification of the relative amount of protein subunits was achieved by scanning gels as described in experimental procedures. The values obtained by densitometric analysis of the blotted LDH isoenzymes are reported as isoform composition (B) and as proportion of predominantly A or B forms, or A2B2 forms (C). * symbol indicates that the difference in the values of strepsirrhines vs. haplorhines was significant (Mann-Whitney U-test, P ≤ 0.05). # symbol indicates that the Kruskal-Wallis test showed significant differences among the following primates groups: strepsirrhines, “monkeys”, and chimpanzees and humans (P ≤ 0.05).

