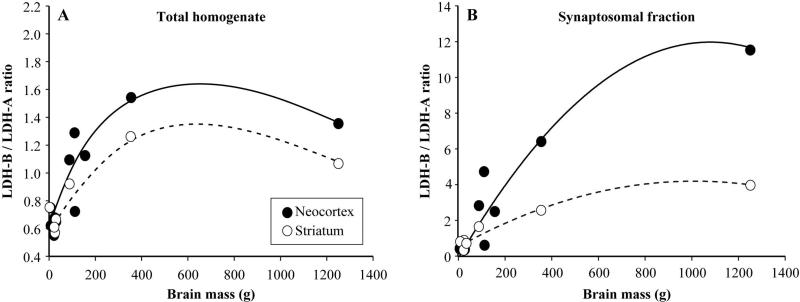
Figure 5.
Analysis of LDH ratio versus brain mass. Graphs show the association between the ratio of LDH-B / LDH-B expression in total homogenates (A) and synaptosomal (B) fractions versus brain mass across primates. A cubic spline is fit to the data from total homogenates and the best fit quadratic function is fit to the data from synaptosomes.

