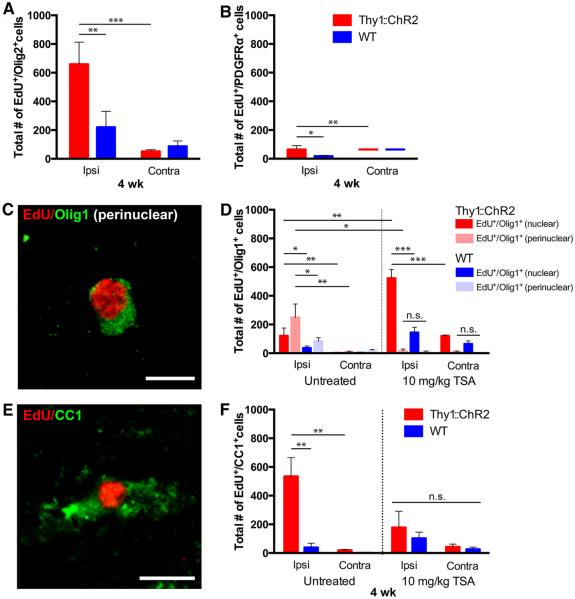
Fig. 5. Neuronal activity promotes oligodendrogenesis.
Thy1::ChR2 and WT optogenetically stimulated mice sacrificed 4 weeks after a 7-day stimulation paradigm (P35 to P42) with (n = 4 Thy1::ChR2 and 3 WT) or without (n = 7 per group) exposure to TSA (10 mg/kg). (A to F) Cell identity markers of EdU-marked surviving cells quantified in the M2 cortex reveal that the majority of the remaining EdU+ cells are in the oligodendroglial lineage [Olig2+, (A)], with diminution of the oligodendrocyte precursor cell (PDGFRα+) population (B) and concomitant appearance of EdU+ immature oligodendrocytes [(D); nuclear Olig1+; red and dark blue bars] and mature oligodendrocytes marked by perinuclear Olig1+ [(C and D), pink and light blue bars] and CC1 (E and F). (C and E) Representative confocal micrographs illustrating colocalization of EdU (red) with perinuclear Olig1 [green (C)] or CC1 [green (E)]. Scale bars, 10 μm. (D and F) Administration of the histone deacetylase inhibitor TSA during the week of stimulation results in a blockade of mature oligodendrogenesis. TSA-treated groups are shown on the right halves of these graphs. Increased numbers of immature (Olig1nuclear+) oligodendrocytes in the TSA group are consistent with an epigenetic blockade of precursor differentiation. In all graphs, red or pink bars indicate Thy1::ChR2 mice; blue bars denote identically manipulated WT littermate controls. *P < 0.05, **P < 0.01, ***P < 0.001. n.s. represents P > 0.05. Error bars indicate SEM. Value of (—) over x axis = 0 ± 0.

