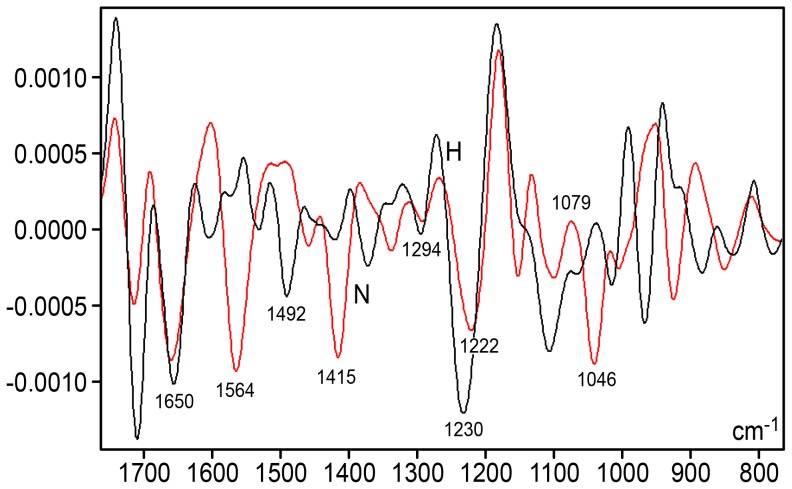
Figure 5. Savitzky-Golay's second-derivative spectra for the liver DNA from NOD mice.
Detail for the IR spectral window in the 1750–800 cm−1 range. Normoglycemic mice (N), red line; hyperglycemic mice (H), black line; X axis, wavenumbers in cm−1; Y axis, second derivative. Software: Grams/AI 8.0; 2nd derivative degree: 2, points: 31.

