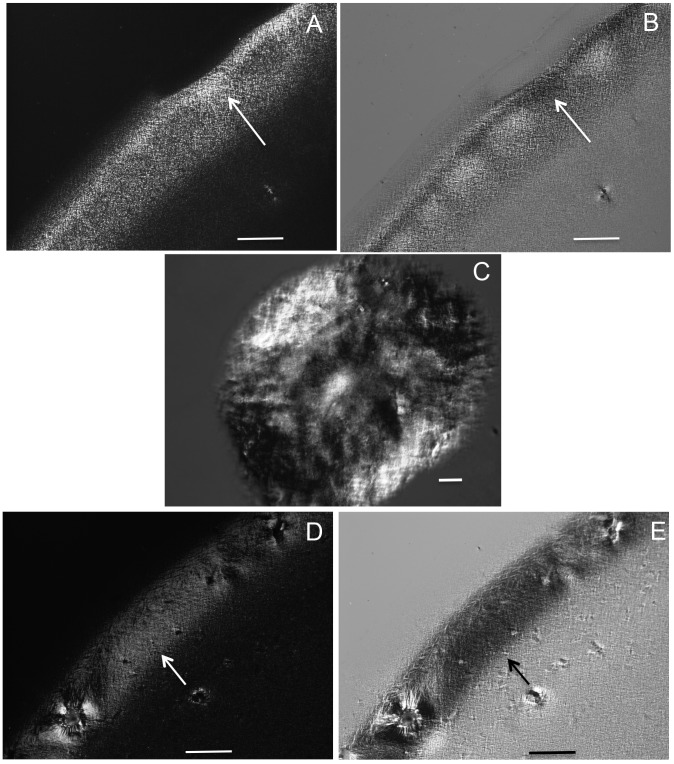
Figure 7. Optical anisotropy aspects of the DNA samples extracted for FT-IR analysis.
Birefringence images are shown for the liver DNA from normoglycemic (A,B) and hyperglycemic (C-E) mice. Birefringence brilliance in the outer region of DNA drops dried on slides in A and D was compensated in B and E, respectively (arrows). The bars equal 100 µm.

