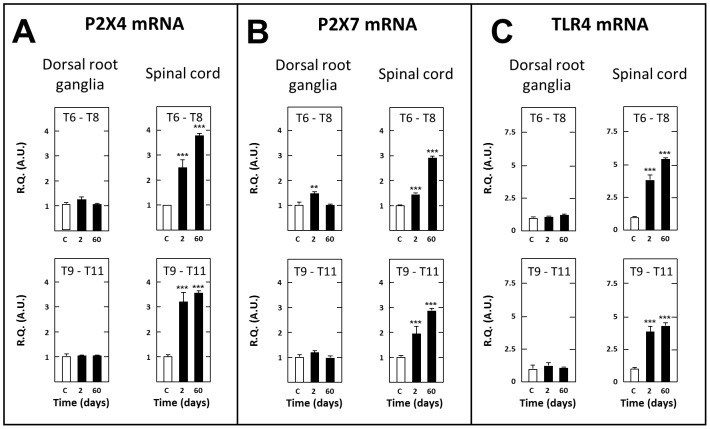
Figure 9. Short- and long-term changes in levels of transcripts encoding P2×4 (A), P2×7 (B) and TLR4 (C) in dorsal root ganglia and spinal tissues in spinal cord-transected rats.
Real-time RT-qPCR determinations were made in T6–T8 and T9–T11 dorsal root ganglia and T6–T8 and T9–T11 spinal segments at day 2 or 60 (abscissa) after spinal cord transection at T8–T9 level. Data are expressed as the ratio of specific mRNA over GaPDH mRNA [R.Q.(A.U.)]. Each bar is the mean + S.E.M. of n independent determinations (D2: n = 6; D60: n = 12). Sham values at every postoperative time are pooled under “C” (control) on abscissa. ** P<0.01, *** P<0.001 compared to respective levels in sham-operated rats (C). Two-way ANOVA followed by Bonferroni test.

